


Shopify (SHOP) continues to show strong potential for growth, which is supported by fundamentals and technicals. As the broader e-commerce market expands, SHOP is well-positioned to capture additional market share from rivals such as Amazon.com (AMZN), thanks to its competitive suite of solutions for businesses of all sizes. SHOP has continued outperforming its peers in earnings and revenue growth, which supports its future growth.
Recently, SHOP’s stock price broke out above its trading range and has pulled back to its $67 support level. This provides an attractive risk/reward opportunity for bullish exposure. The stock is also trading above its 200-day simple moving average, a positive trend signal, with a potential breakout to the $85 level based on historical price action. This gives investors an entry point near a solid support level while maintaining significant upside potential.
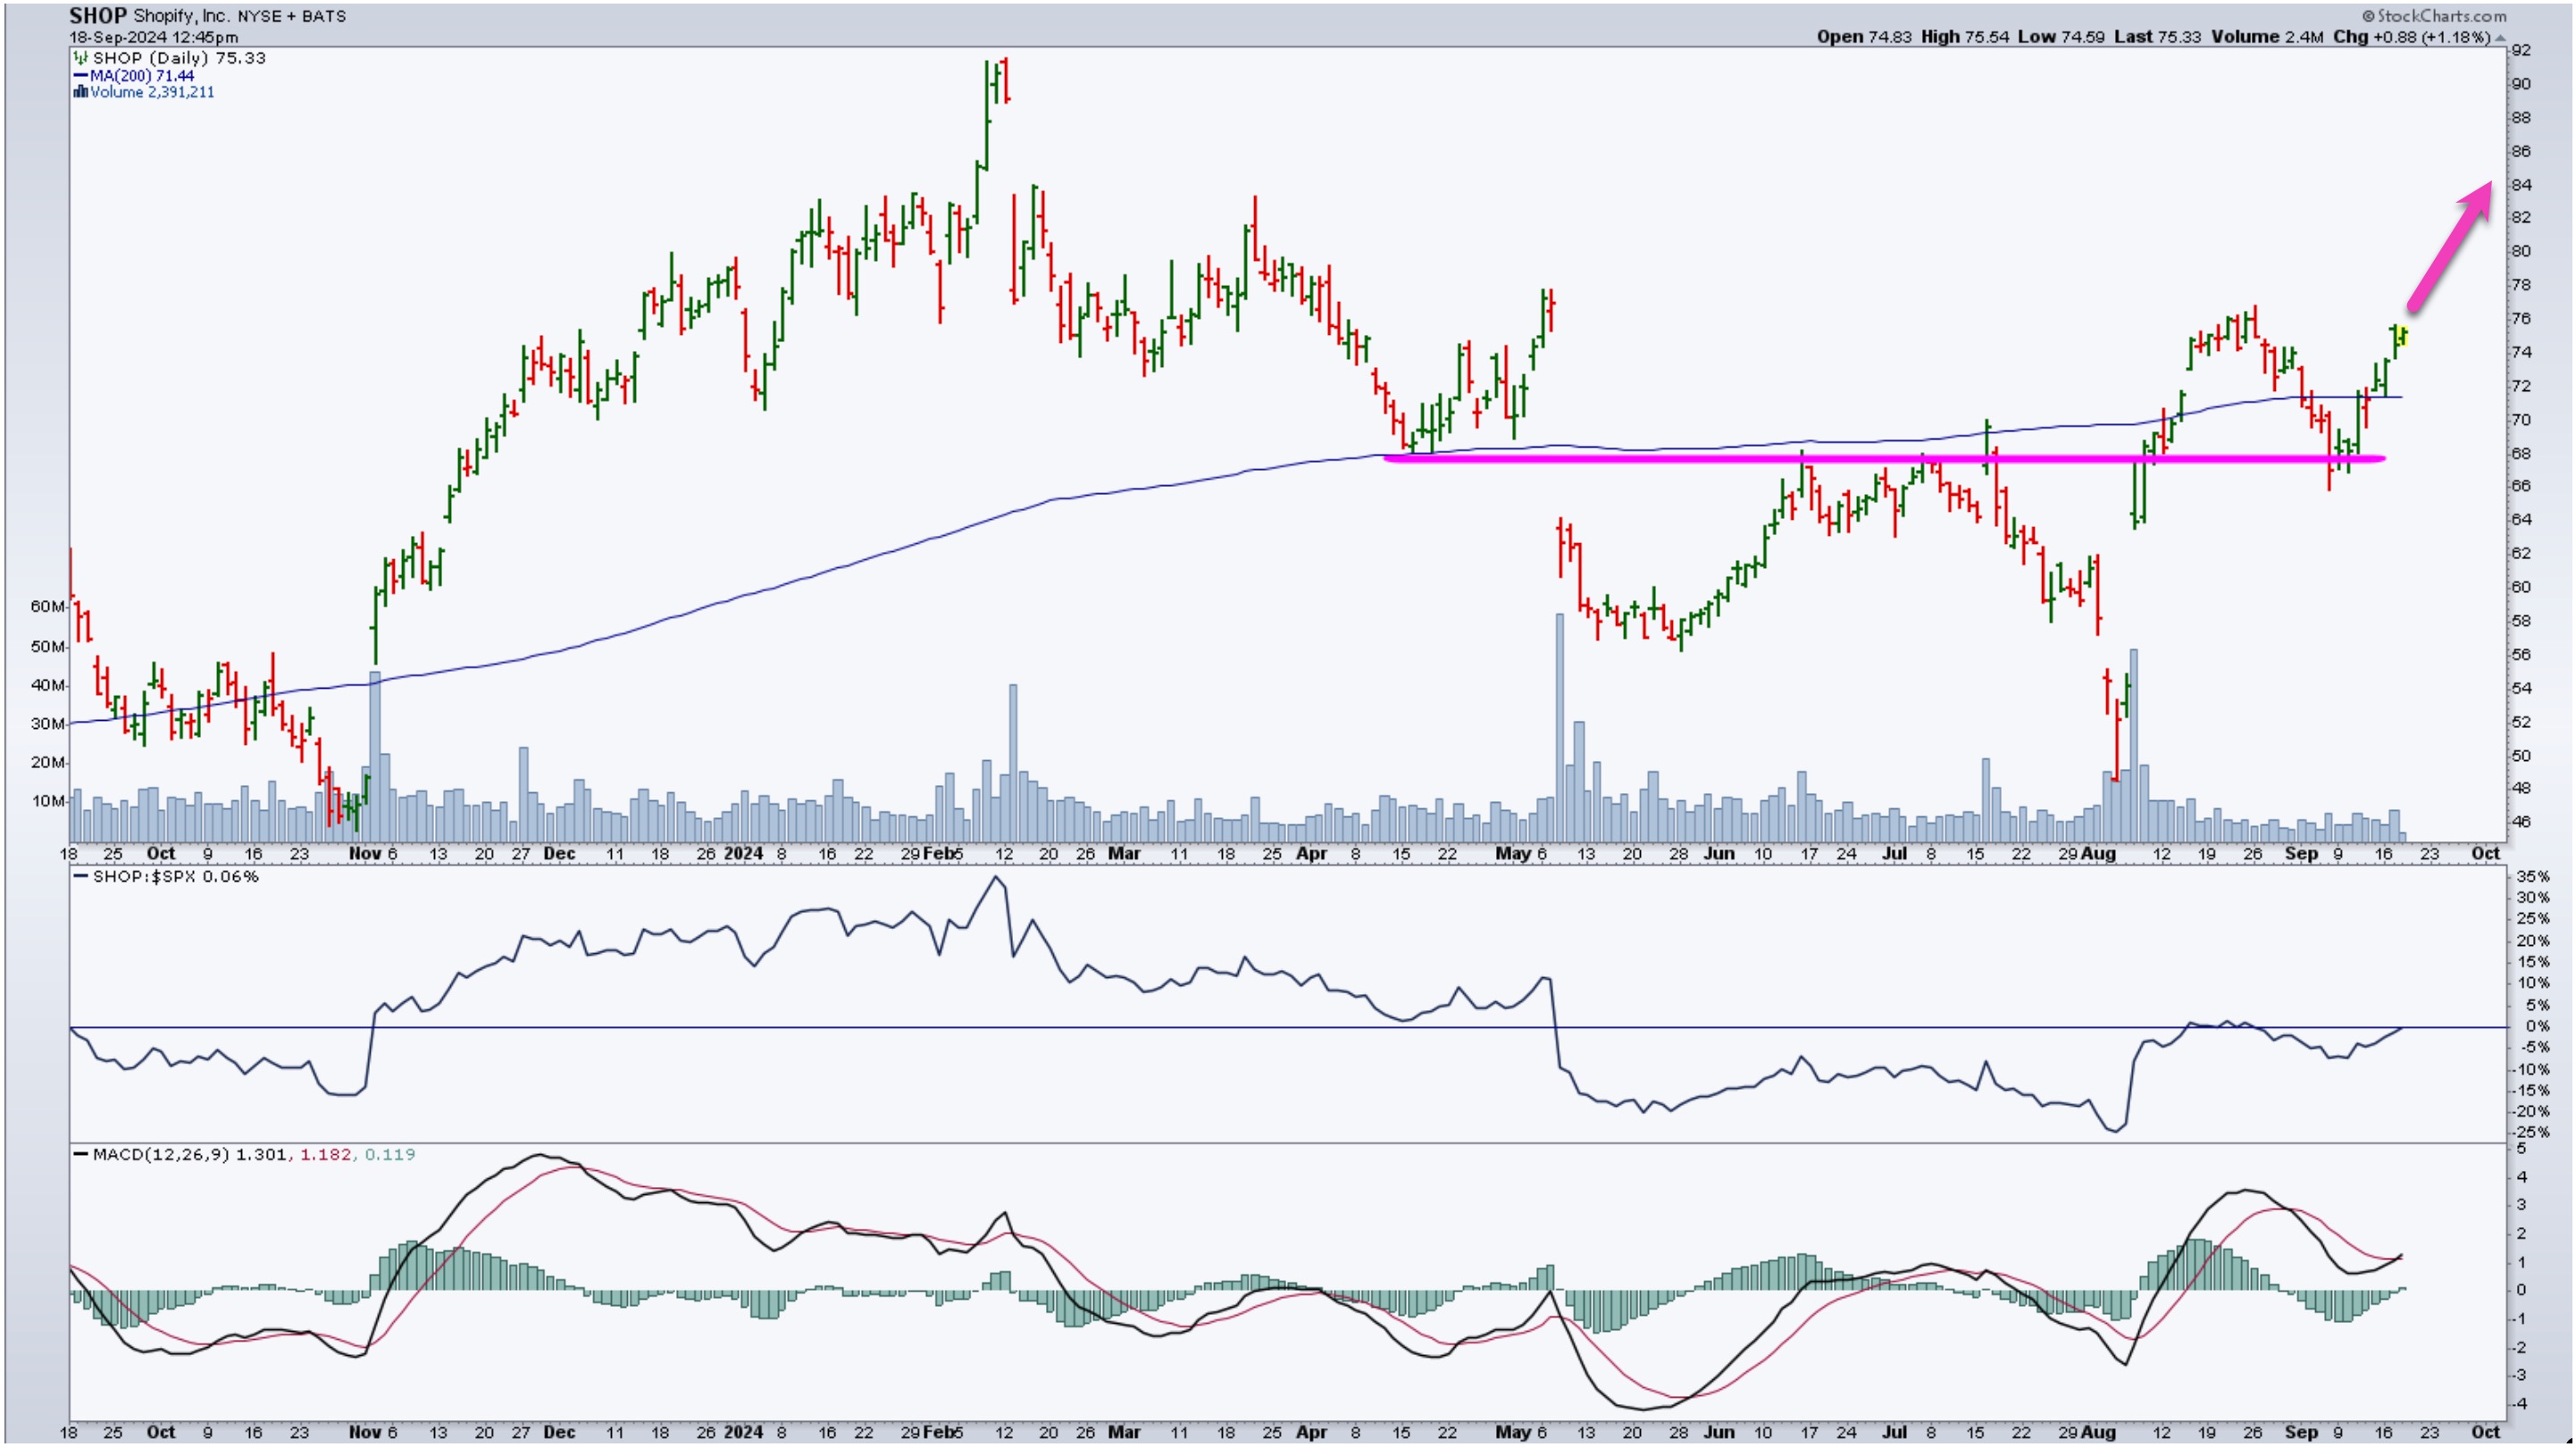
CHART 1. DAILY CHART OF SHOP STOCK. After breaking out of a trading range, SHOP’s stock price has pulled back to a support level. SHOP has the potential to break out to the $85 level. The stock is trading above its 200-day moving average, its relative strength to the S&P 500 is close to zero, and the MACD is in the early stages of a bullish crossover.Chart source: StockCharts.com. For educational purposes.
Fundamental Analysis of SHOP Stock
Shopify’s valuation appears fairly justified, with a Forward P/E ratio of 53.47x, which is high but reflects its exceptional expected earnings per share (EPS) growth rate of 185.5%, compared to an industry average of only 13.68%. Its expected revenue growth of 21.88% also outpaces the industry average of 8.59%. Moreover, despite the high valuation, SHOP maintains healthy net margins at 16.33%, close to the industry average of 17.83%. This rapid growth and strong profitability metrics support the stock’s long-term bullish outlook.
SHOP Stock Options Structure
I recommend a Call Vertical Spread using the SHOP November 1, $75/85 strikes at a net debit of $2.96 to take advantage of this potential upside. This trade entails:
• Buying the Nov 1 $75 calls at $4.33
• Selling the Nov 1 $85 calls at $1.37
Below is the risk curve for the Call Vertical Spread.
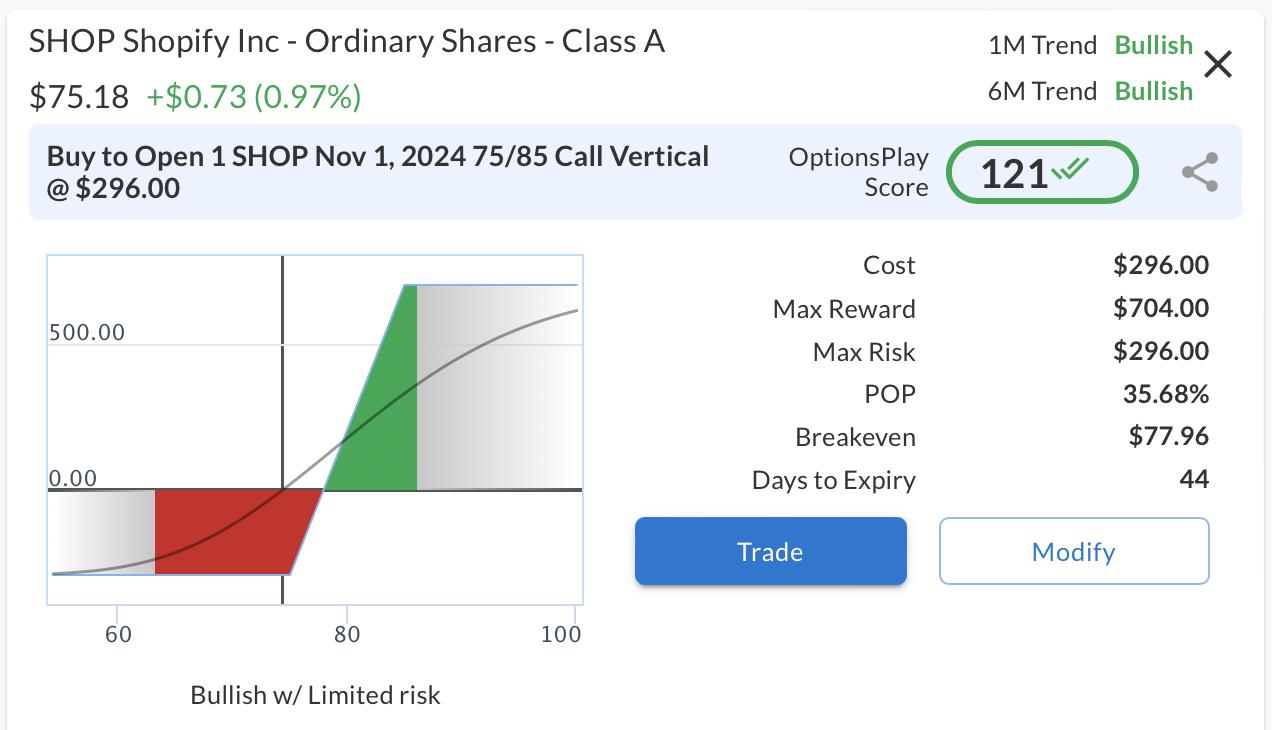
This options strategy offers a maximum reward of $704, with a risk of $296, providing a favorable risk/reward ratio. The breakeven price for the trade is $77.96, meaning Shopify’s stock price only needs to trade slightly above its current levels for this strategy to be profitable. If SHOP reaches $85 or higher by expiration, this trade could achieve a 238% return on investment!


