


Dogecoin and Shiba Inu: Daily Targets and Prices
- Today’s bullish consolidation pushed Dogecoin’s price to 0.11494, marking a new weekly high
- The price of Shiba Inu is in strong bullish consolidation, leading to the formation of a new weekly high at 0.00001657
Dogecoin chart analysis
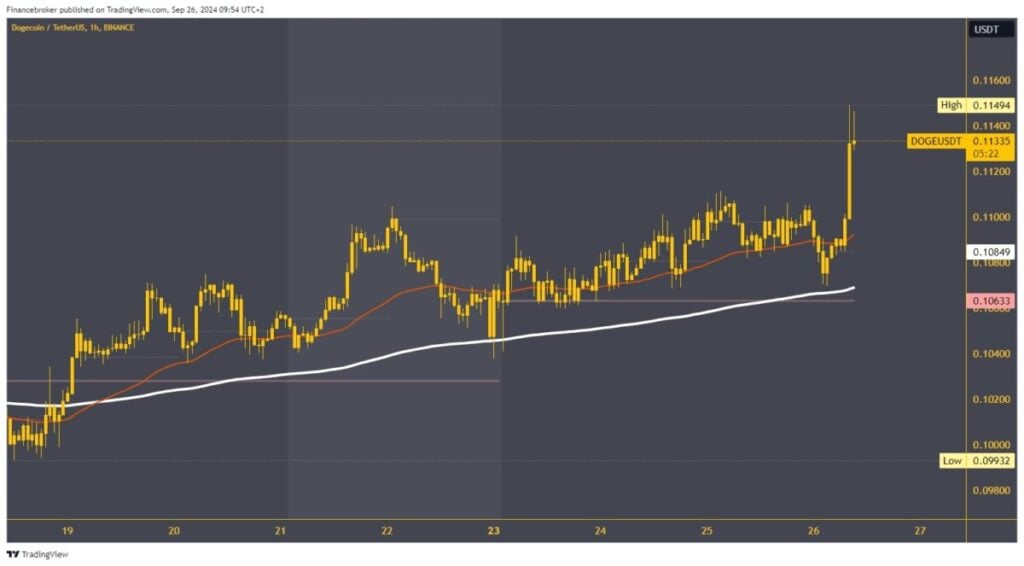
Today’s bullish consolidation pushed Dogecoin’s price to 0.11494, marking a new weekly high. This morning, we saw a brief pullback to the support level at 0.10700. Additional support came from the EMA 200 moving average in that zone, after which the price initiated a bullish consolidation. Dogecoin easily broke through the weekly resistance zone around 0.11100, strengthening the bullish momentum for today’s surge.
The price is now at 0.13500 and is attempting to hold above the 0.11200 level. If it succeeds, it will have the chance to continue its previous bullish trend. Potential higher targets are at the 0.11600 and 0.11800 levels. For a bearish scenario, Dogecoin would need to drop below the 0.11100 level, which would return it to the previous range from earlier in the week. Potential lower targets are at the 0.11000 and 0.10800 levels. The EMA 200 moving average remains main support for staying on the bullish side.
Shiba Inu chart analysis
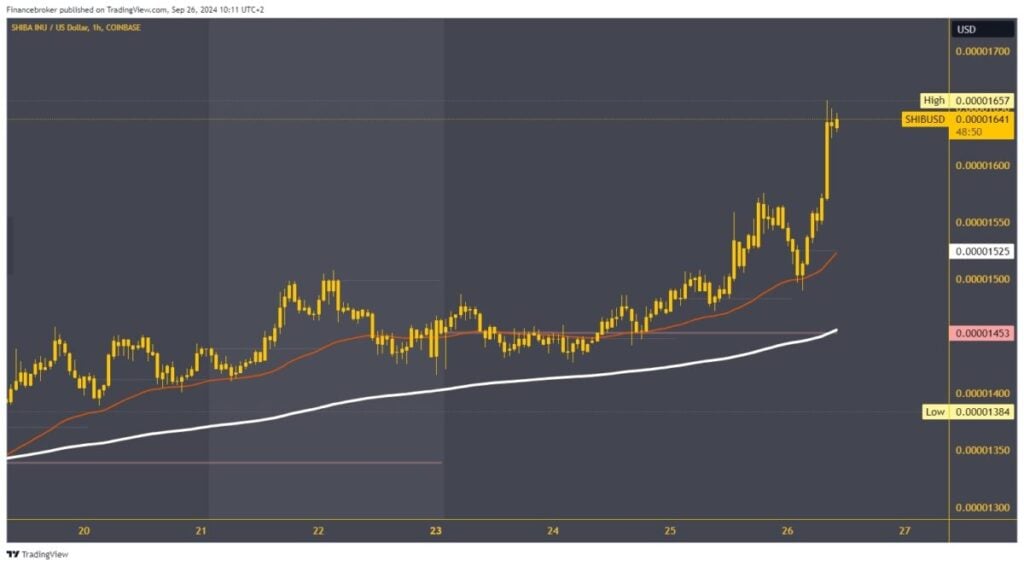
The price of Shiba Inu is in strong bullish consolidation, leading to a new weekly high at 0.00001657. Currently, we are at the 0.00001640 level and are successfully holding within the zone of this week’s high. Shiba Inu could soon reach a new weekly high if the bullish momentum continues. Potential higher targets are at the 0.00001700 and 0.00001800 levels.
If a pullback occurs below the 0.00001600 level, it would indicate that Shiba Inu lacks the strength to continue its upward movement, leading to a retracement to a new low. Potential lower targets are at the 0.00001550 and 0.00001500 levels. Around the 0.00001525 zone, we will test the daily open level and the EMA 50 moving average. Stronger support lies around the weekly open level, near the EMA 200 moving average.
The post Dogecoin and Shiba Inu: Daily Targets and Prices appeared first on FinanceBrokerage.


