


Pepe coin price is back on investors’ radars as the meme coin turned bullish in the past couple of weeks. Reacting to Ethereum, PEPE broke out of a bullish continuation pattern, complete with a retest for confirmation. PEPE-ETH correlation could cause the increased Ether burns to spur a surge in the price of Pepe Coin.
Ether Burns Spike Amid Pepe Coin Price Rise
According to data from LookonChain, the rate of Ether (ETH) burnt daily has surged significantly over the past week.
The daily $ETH burnt has increased by 163% over the past week!
Below is a chart showing the $ETH price and daily $ETH burnt.
From this chart, we can see that the daily $ETH burnt began to surge before the $ETH price increased in January and October 2023. pic.twitter.com/QOubaVLF2G
— Lookonchain (@lookonchain) September 25, 2024
Historically, the burn rate trend shows that the Ethereum price increase coincided with a spike in the ETH burn rate. The recent growth in rate burns surpassed the June high, not including the anomaly spike observed in August.
This information is fascinating for Pepe Coin investors, as the two assets have shown a high level of correlation in the past.
According to IntoTheBlock, the PEPE 60-day correlation with ETH was 0.92 at press time, above the correlation it shares with Bitcoin, which stood at 0.84, and an increase from June’s 0.91. The correlation values range from -1 to +1. When the reading is close to -1, prices hardly move in the same direction. However, if the reading is close to +1, prices usually head in the same direction. And that is the case with ETH and PEPE.
Should Ethereum continue to rise, the Pepe Coin price could surge, too. The PEPE price has increased by 7% in the last 24 hours and is trading at $0.000009.
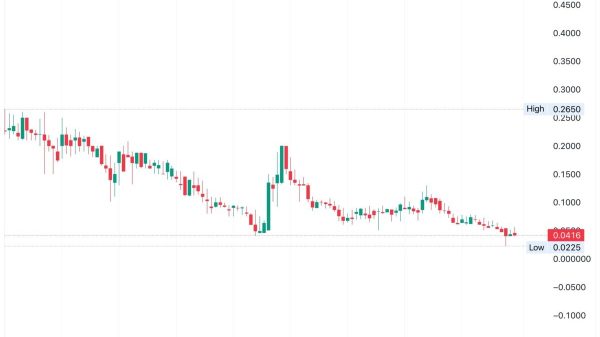
PEPE Technical Analysis: $0.00001250 Next Stop
PEPE price is in a recovery phase after a downtrend, showing a bullish breakout from an ascending triangle pattern. The upward price movement and breakout above resistance suggest further bullish momentum with key resistance levels around $0.000001269 and beyond.
On the flip side, PEPE may find support around $0.00000080 and $0.00000070 in case of a pullback.
The ascending triangle is a continuation pattern, and its breakout signals an impending upward move. The measured move (height of the pennant) targets a price of around $0.000001269, representing a 45.15% potential upside from the breakout level.
Pepe Coin Price Chart
If the Pepe coin price falls below $0.00000080, it would signal market weakness, making the asset bearish. PEPE price would find lower support around $0.00000070.
The post Pepe Coin Price Eyes 45% Gains as ETH Burns Surge 163% appeared first on CoinGape.


