


S&P 500 and Nasdaq: New support and targets on Friday
- This week has not been kind to the S&P 500 index
- The value of the Nasdaq index retreated to the 19614.1 support level on Tuesday
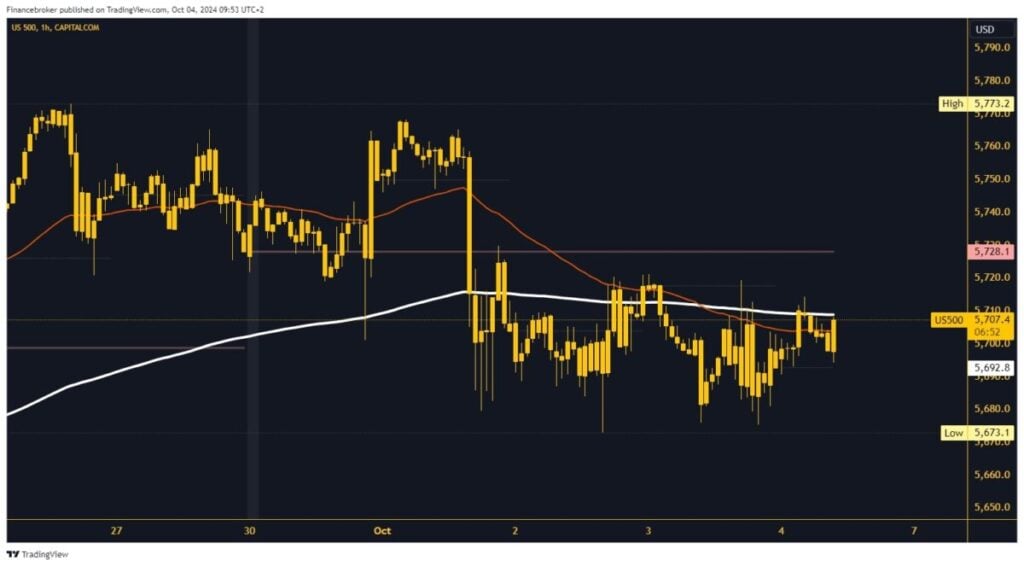
S&P 500 chart analysis
This week has not been kind to the S&P 500 index. On Tuesday, we had a strong bearish consolidation; on Wednesday, we formed a new weekly low at the 5673.1 level. From then until now, we see a sideways movement of the index in the 5675.0-2720.0 range. Additional pressure in the upper zone makes the EMA 200 moving average. Today’s picture has slight positive indications as support has risen to the 5695.0 level.
Expectations are growing that the S&P 500 has enough strength to jump over the EMA 200 and continue towards the weekly open zone around 5730.0. If we succeed in this, the optimism for the continuation to the bullish side grows. Potential higher targets are 5740.0 and 5750.0 levels. For a bearish option, we need a negative consolidation and a pullback of the index below the 5680.0 level. With those steps, we will put pressure on the support zone, and we need a break below to confirm the bearish scenario. Potential lower targets are 5670.0 and 5660.0 levels.
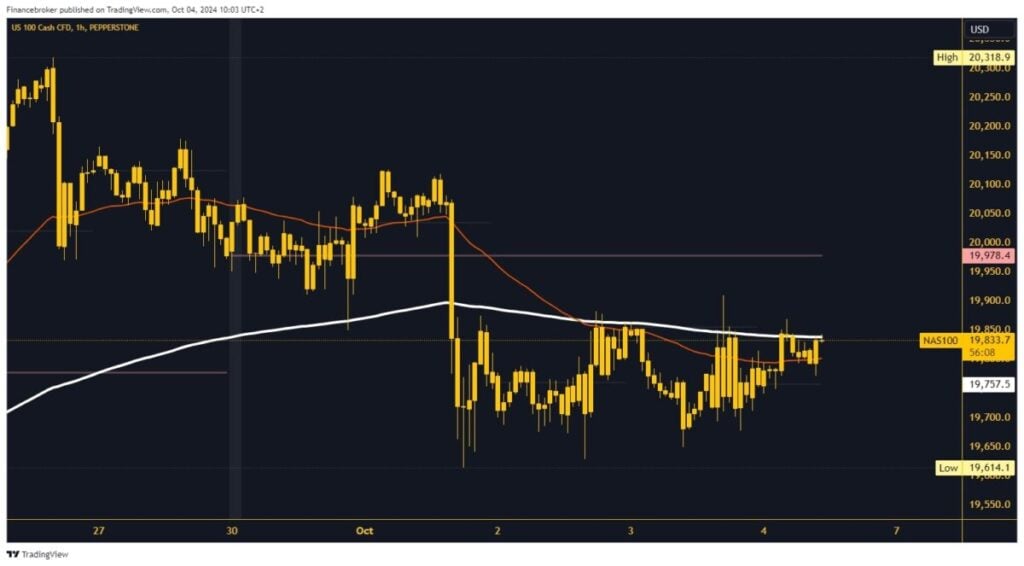
Nasdaq chart analysis
The value of the Nasdaq index retreated to the 19614.1 support level on Tuesday. After that, the index starts the initial consolidation in the 19650.0-19850.0 range. During this morning’s Asian session, we moved close to the upper line of the current range, and there we encounter the EMA 200 moving average. To continue on the bullish side, we need an impulse above at least the 19900.0 level.
That should be plenty of room for the Nasdaq to consolidate above the EMA 200 and continue to rise. Potential higher targets are 19950.0 and 20000.0 levels. For a bearish option, we need a negative consolidation and pullback down to the 19650.0 support level. This puts pressure on this week’s support zone. New pressure could easily push the Nasdaq to a new low and thus confirm the move to the bearish side. Potential lower targets are 19600.0 and 19550.0 levels.
The post S&P 500 and Nasdaq: New support and targets on Friday appeared first on FinanceBrokerage.


