


Oil and Natural Gas: New Supports and Targets on Friday
- During this morning’s Asian session, the price of oil was in a slight retreat from the $76.00 level
- This week’s bearish consolidation of natural gas prices was stopped on Thursday at the $2.82 level
Oil chart analysis
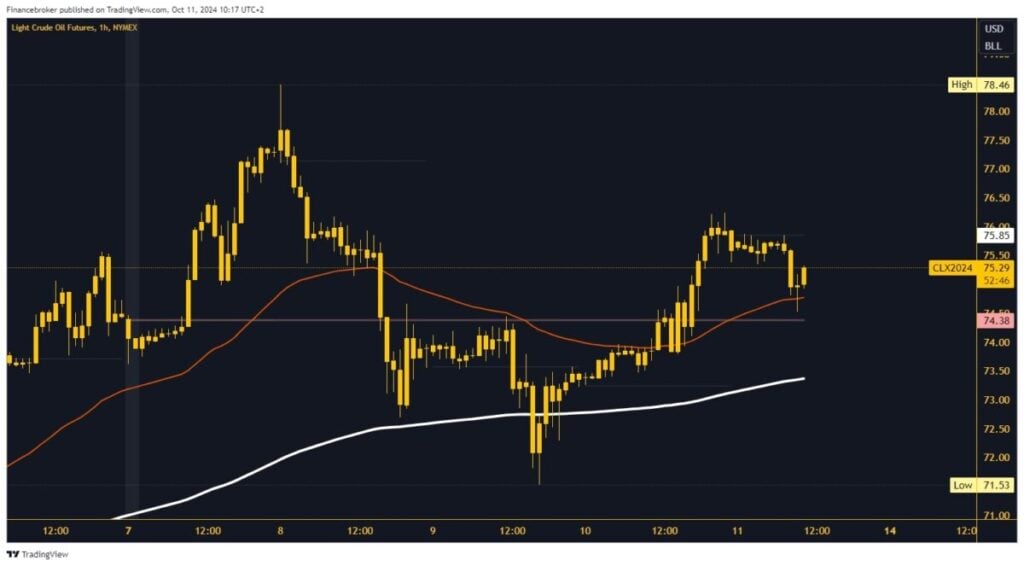
During this morning’s Asian session, the price of oil was in a slight retreat from the $76.00 level. In the EU session, we saw a stronger bearish momentum down to the $74.50 level. For now, we are successfully holding there, and with the help of the EMA 50 moving average, we are again turning to the bullish side. If the support is sufficient, we expect to see a continuation of the bullish consolidation and a return to the $76.00 level.
Potential higher targets are $76.50 and $77.00 levels. For a bearish option, oil needs to pull down to $74.00. With that step, we fall below the EMA 50 and the weekly open level. This will significantly increase the pressure on the price to continue its retreat. Potential lower targets are $73.50 and $73.00 levels. Additional support for the oil price is the EMA 200 moving average in the $73.50 zone.
Natural gas chart analysis
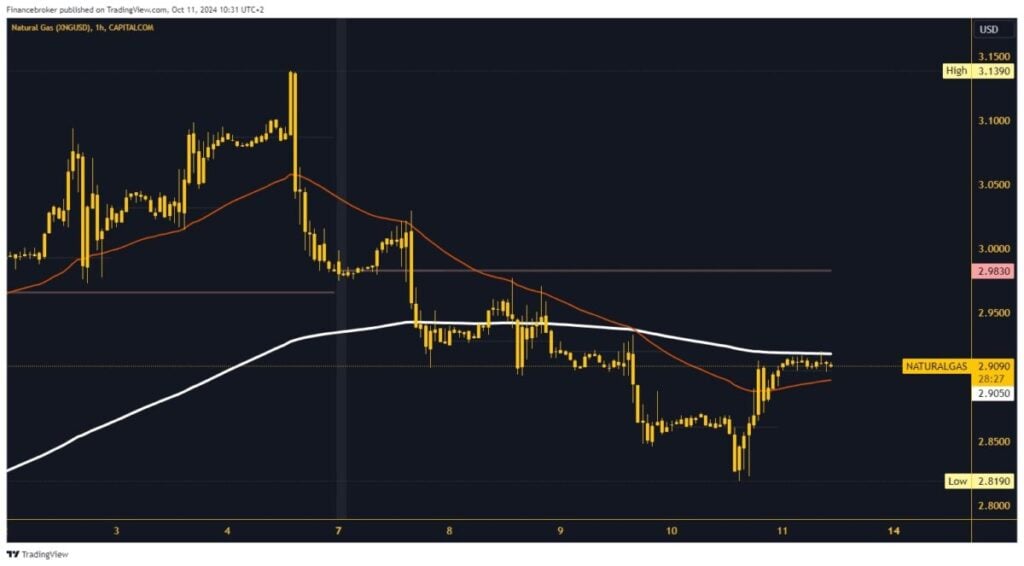
This week’s bearish consolidation of natural gas prices was stopped on Thursday at the $2.82 level. After forming a new weekly low, the price starts a recovery to $2.90. During this morning’s Asian trading session, the movement of natural gas was in the $2.90-$2.92 range. Additional pressure makes the EMA 200 moving average upside down, slightly directing the price to the bearish side.
If the bearish momentum intensifies, the price of natural gas would have to seek new support at lower levels. Potential lower targets are$2.85 and $2.80 levels. For a bullish option, we need a positive consolidation above the EMA 200 moving average and $2.92. Then, we need to stabilize there in order to create a position to continue to the bullish side. Potential higher targets are $2.95 and $3.00 levels.
The post Oil and Natural Gas: New Supports and Targets on Friday appeared first on FinanceBrokerage.


