


S&P 500 and Nasdaq: Targets and Prices for Friday
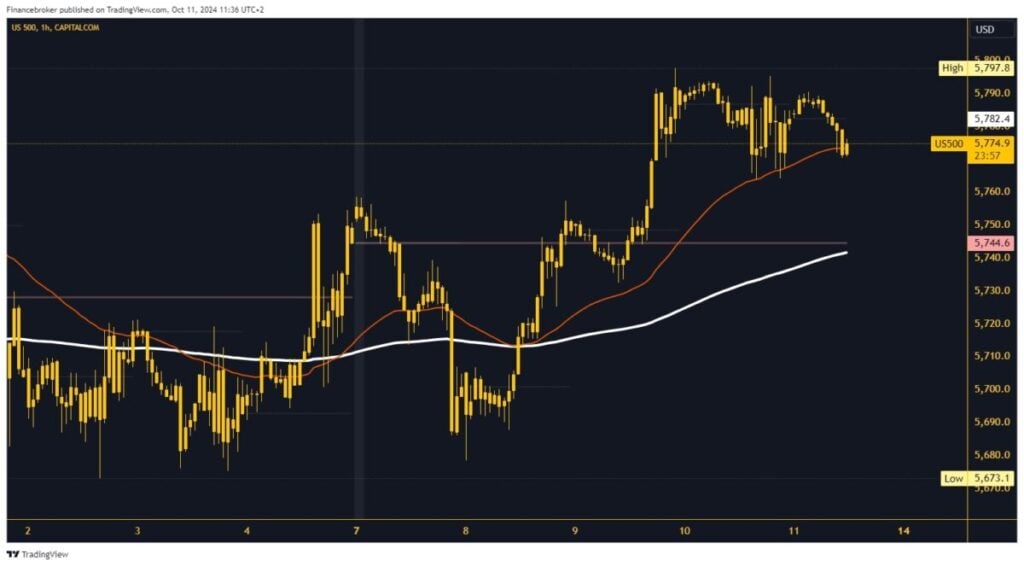
- On Wednesday, a new all-time high for the S&P 500 was formed at the 5797.8 level
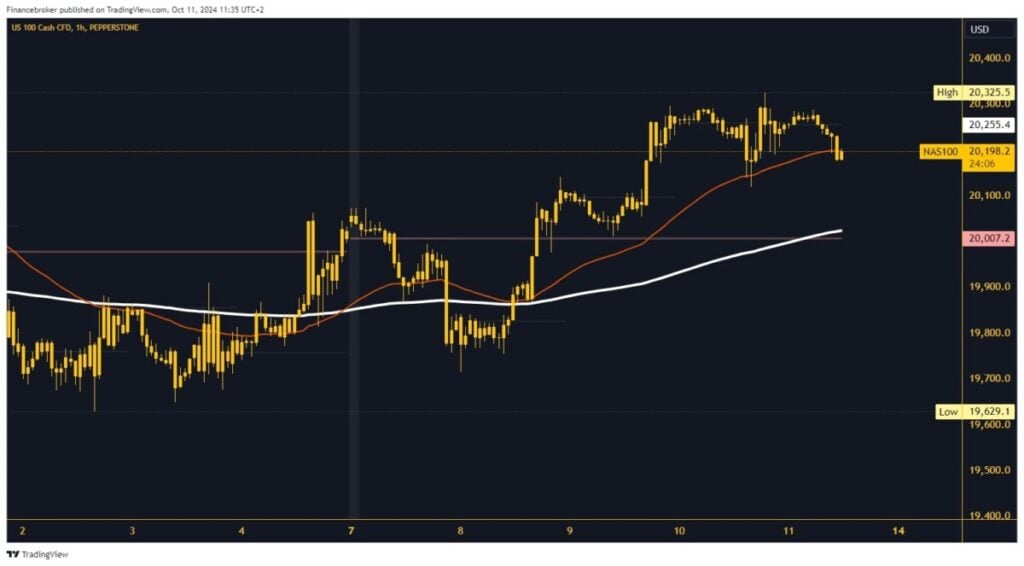
- On Thursday, we saw the Nasdaq index jump to 20325.5, a new October high
S&P 500 chart analysis
On Wednesday, a new all-time high for the S&P 500 was formed at the 5797.8 level. After that, the index goes into lateral consolidation in the 5765.0-5795.0 range. Today’s picture is slightly bearish because we are retreating to the upper zones. We are currently at 5775.0 and testing the EMA 50 moving average along with the lower level of this sideways range. If support is not enough, the S&P 500 will be forced to retreat to a new daily low.
Potential lower targets are $5760.0 and $5750.0 levels. If we get support from the EMA 50 moving average, we expect to see the initiation of a bullish consolidation and return to the daily open level. The S&P 500 will have enough momentum to move above. A new support would be ideal for a continuation to a new all-time high. Potential higher targets are 5800.0 and 5810.0.
Nasdaq chart analysis
On Thursday, we saw the Nasdaq index jump to 20325.5, a new October high. The index loses momentum at that level and moves to the 20200.0 support level. During this morning’s Asian trading session, pressure on the index intensified in the 20300.0 zone, and we saw a drop from the 20180.0 level. We have fallen below the EMA 50 moving average, and it is now an additional pressure that could strengthen the bearish momentum.
Potential lower targets are 20100.0 and 20000.0 levels. The Nasdaq needs to stay above the weekly open level until the end of the day because that would leave it on the bullish side. If we manage to get the support of the EMA 50 moving average at 20200.0, the index could start a bullish consolidation. After that, we will see a return above the daily open level and a test of the weekly high. Potential higher targets are 20400.0 and 20500.0 levels.
The post S&P 500 and Nasdaq: Targets and Prices for Friday appeared first on FinanceBrokerage.


