


During Tuesday’s Asian market session, the Solana price jumped 1.44% to trade at $168.6, while its market cap boosted to $79.04 Billion. This growth was driven by a bullish convergence across three key SOL charts: price trends, on-chain data, and derivatives metrics. The alignment of these indicators signals a strong foundation for Solana price to drive the November rally.
3 Key SOL Charts Signal Major Solana Price Rally Ahead in November
The crypto market returns to its Q4 bullish trend as pioneer cryptocurrency Bitcoin rallies towards $70,000. As major altcoins gear up for a prolonged recovery, Solana is positioned to lead the charge in November, with three key SOL charts signaling a strong bullish outlook.
Solana’s (SOL) TVL Soars 68% as DeFi Confidence Fuels Price Recovery
Along with Solana price recovery, the network’s total volume locked (TVL) has witnessed a sharp growth since August 2024. According to DeFiLlama data, the SOL TVL rallied from $3.8 Billion to $6.43 Billion, its highest value since January 2022, accounting for 68 hikes.
This substantial rise in TVL suggests growing investor confidence in Solana’s DeFi ecosystem, indicating increased liquidity and user participation in its decentralized applications (dApps).
Historical data shows this growth has coincided with sustainable price recovery as it reinforces the network’s fundamental improvement.
Ethereum-Killer SOL’s Futures Market Hints Bullish Outlook
According to Coinglass data, the SOL OI-Weighted funding rate has recently spiked to 0.0181%, a value last recorded in June 2024. This spike indicates increased demand for long positions in the Solana futures market, as buyers are ready to pay a premium to sellers for holding their bullish position.
Theoretically, this indicator highlights a bullish sentiment among market participants and anticipation for a prolonged recovery trend.
SOL OI-Weighted Funding Rate | Coinglass
Solana Price Analysis: Bulls Eye 9% Surge Before Major Breakout
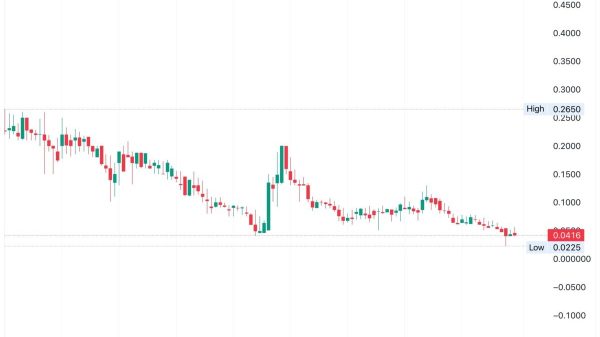
In the last six weeks, the Solana price prediction showcased a notable recovery from $120 to $167— a 39% growth. A closer look at the daily chart shows the rally developed into a bullish reversal pattern called an inverted head and shoulder pattern.
This pattern consists of a middle ‘head’ dipping lower than the two ‘shoulders,’ signaling renewed demand pressure at the bottom support, with buyers gearing up for a significant reversal.
On October 20th, the SOL price gave a decisive breakout from the pattern’s neckline resistance at $160. If sustained, the post-breakout rally should drive a 9.5% surge to challenge the key resistance trendline that carried a consolidation trend since March 2024.
A potential breakout from this overhead trendline would be crucial for Solana to resume its prevailing uptrend.
SOL/USDT 1d Chart
On the contrary, if Solana price witnessed renewed selling pressure at the $180 region, the sellers could force a prolonged consolidation in November.
The post 3 SOL Charts Hinting At Major Solana Price Rally in November appeared first on CoinGape.


