
BNB price has dropped by ∼22.7% from the year-to-date high, but the weekly chart points to an eventual rebound as it has formed a cup and handle and bullish flag patterns. Binance Coin was trading at $560, down by ∼10% from its October highs.
BNB Price Forms a Cup and Handle Pattern
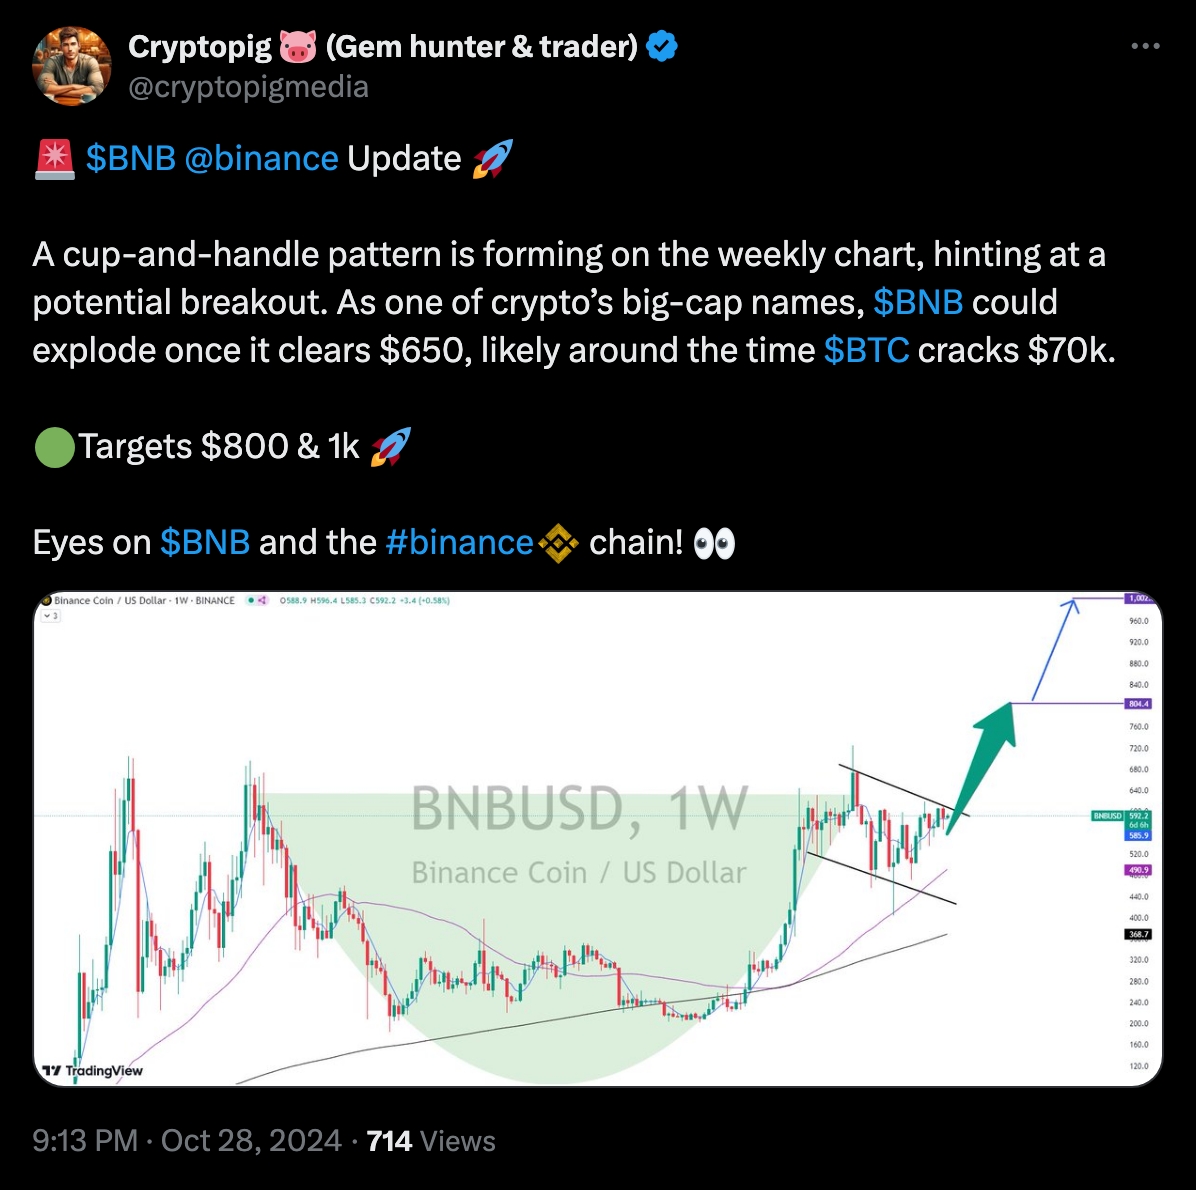
In an X post, Crypto Pig, a trader with over 37,000 followers noted that the BNB price was on the cusp of a big bullish breakout, citing the cup and handle pattern. He expects that the coin will blast upwards when it clears the important resistance level at $650.
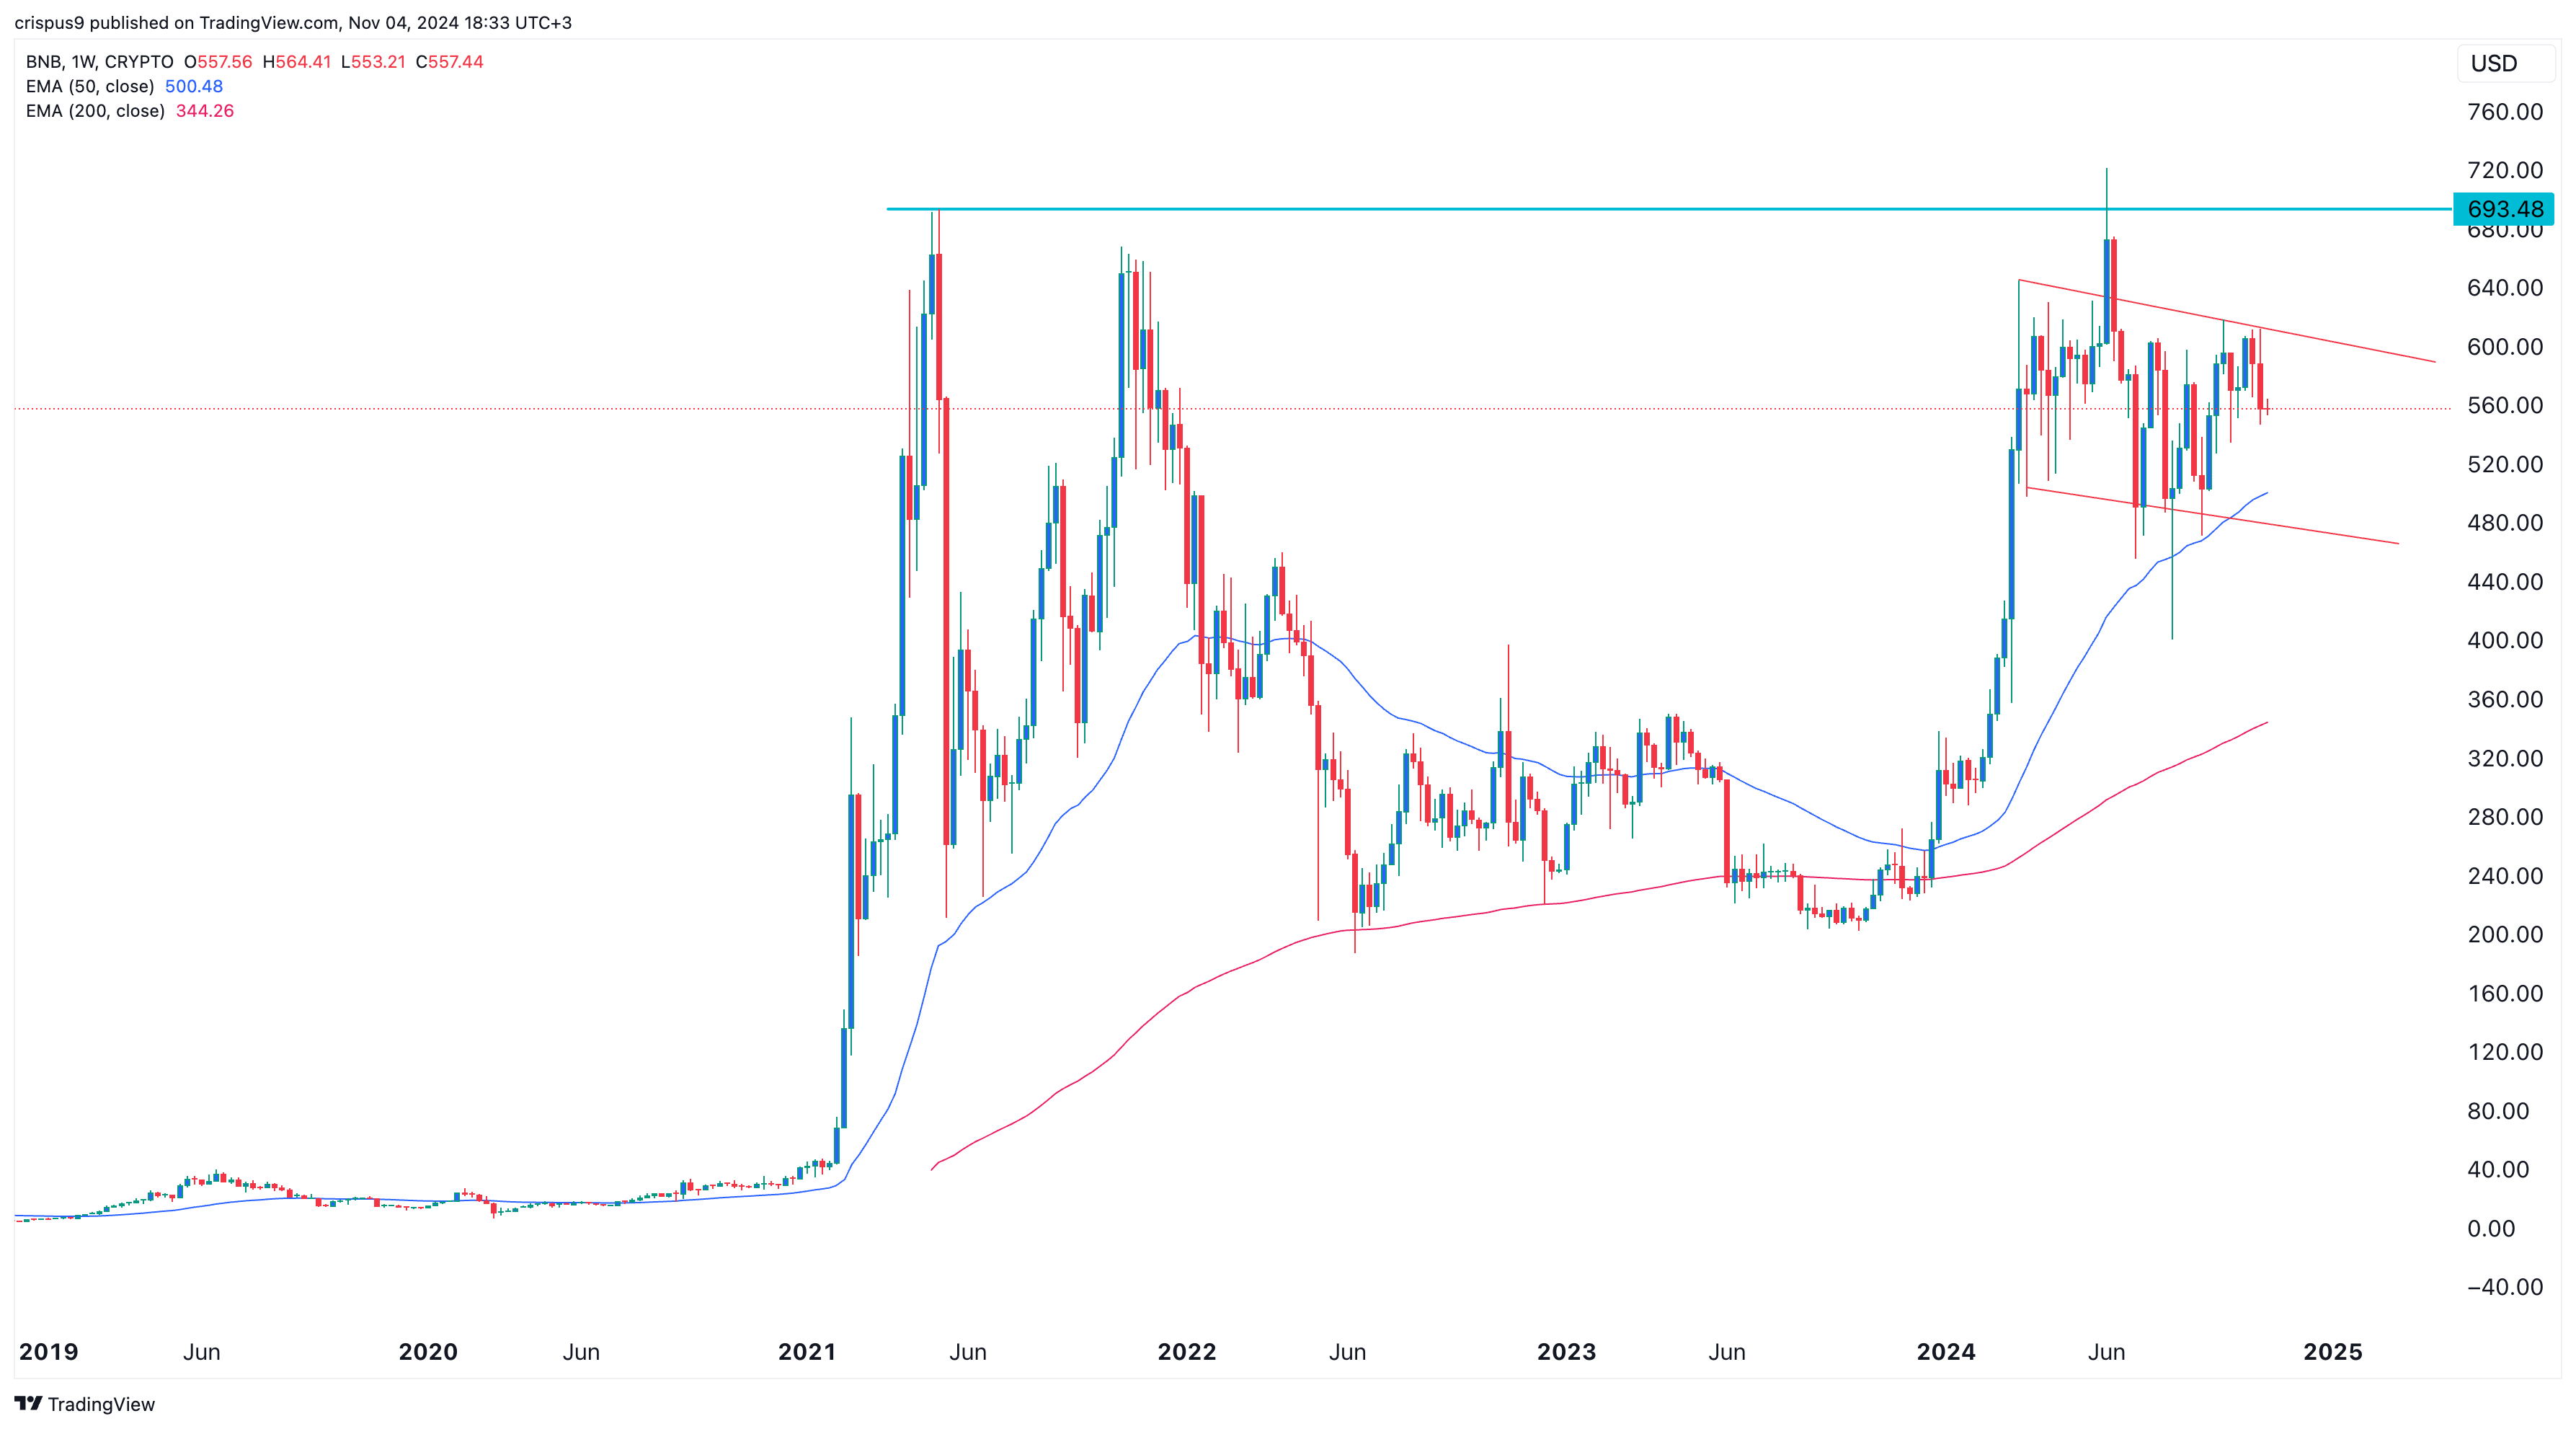
The weekly chart confirms that the coin has formed this C&H pattern, which is characterized by a rounded bottom, followed by a pullback or a consolidation phase. In Binance Coin’s case, the lower part of the pattern happened in June 2022, while its upper side was near the psychological point at $700.
BNB coin has been forming the handle section since March this year. For this pattern to work out, Binance Coin will need to have a strong breakout above $700.
The depth of the cup, which is measured by subtracting the upper and lower sides of the cup, is $512. As such, we can estimate that the coin will bounce back to ∼$1,212 in the long term since the C&H takes months or even years to form.
This 112% bounce potential will be invalidated if the coin drops below the support at $397, its highest swing on November 7. If the Binance Coin price drops below that point, it will point to more sell-off, potentially to the psychological support at $300.
Binance Coin Eyes Breakout From Bullish Continuation Pattern
At the same time, it has formed a bullish flag pattern, which is characterized by a long vertical line, followed by a rectangle-like pattern. A flag is often one of the most popular continuation signs in the market.
In its case, a potential bullish breakout will be confirmed if it moves above the upper side of the flag pattern. More gains will then be validated if it crosses the resistance level at $700.
BNB chart by TradingView
Fundamentally, the BNB price will be supported by the ongoing burn activity. Just last week, the BNB Chain burned 1.77 million tokens worth $1 billion. A token burn removes tokens from circulating, making the remaining ones more valuable.
Another potential catalyst will be a Donald Trump win in the US election followed by an interest rate cut by the Federal Reserve. BNB Chain is also seeing strong activity, with its DeFi assets and DEX transactions rising.
The post BNB Price Prediction as Binance Coin Forms C&H Pattern appeared first on CoinGape.


