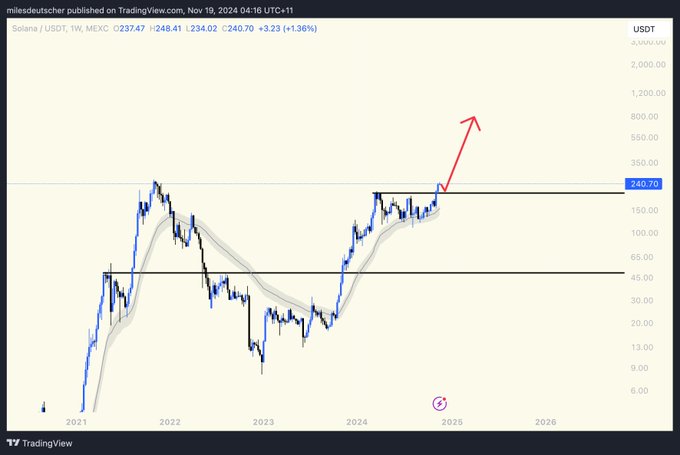

Solana (SOL) price in the last 24 hours has shown bullish momentum, with its price ranging between $247.09 and $234.15. However, at press time, Solana is trading at $237, reflecting a 1.08% decline from a key resistance level.
Despite this minor retracement, analysts predict that Solana could be on the cusp of a breakout this week, potentially setting a new all-time high.
Will Solana Price Rise This Week?
Solana’s recent price performance aligns with strengthening on-chain metrics, suggesting a positive trend for the cryptocurrency. Open Interest (OI) for Solana reached a record high of $5.45 billion earlier this week, according to Coinglass data. This increase indicates growing liquidity and the entry of new funds into Solana’s market, a typical indicator of strong buying activity.

Additionally, data from DefiLlama shows Solana’s weekly trading volume surged to $41.60 billion in mid-November, the highest in its history since 2020. This represents a sharp rise from $18.14 billion recorded just a week earlier. The rise in trading activity suggests heightened market participation and confidence in Solana’s ecosystem.
DefiLlama also reports that Solana generated $49.64 million in transaction fees last week, setting another record. This increase in network activity bolsters the platform’s overall bullish outlook, showing that both traders and developers are actively engaging with the chain.
SOL Technical Indicators Point Toward ATH
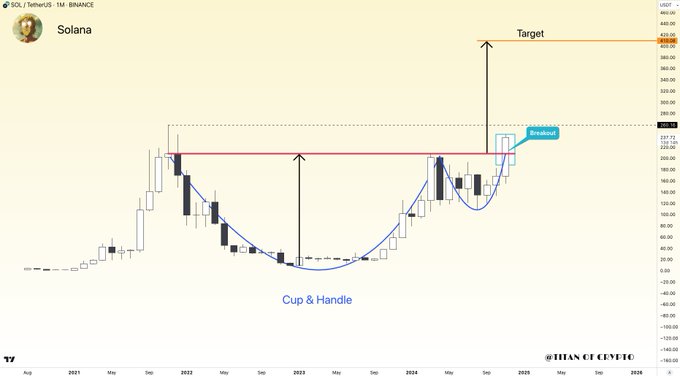
Technical chart patterns for SOL price indicate the potential for continued upward momentum. Analysts have identified a bullish cup-and-handle formation on Solana’s monthly chart, which historically carries a 95% success rate for further gains. Independent crypto analyst Titan of Crypto explained, “Once Solana clears its previous all-time high, it could surge toward $400.”
Meanwhile, shorter-term analysis identifies key resistance levels at $260 and $278. A break above these levels could trigger a rally, while support remains strong at $220. Analysts believe the $360-$400 range is achievable once Solana price breaks past its current resistance.
Another bullish pattern noted by crypto researcher Aylo highlights Solana’s potential to outperform Ethereum. Aylo stated,
“If SOL reaches a new all-time high against Bitcoin, it will achieve something Ethereum didn’t manage in the last cycle.”
Bullish Pennant Formation Signals Further Gains
A key bullish indicator for Solana price lies in its technical chart, which displays a bullish pennant pattern. This pattern, formed after a strong upward price movement followed by a consolidation phase, typically signals the continuation of the previous uptrend.
A breakout above the pennant’s upper boundary, which aligns with the $260 resistance level, could ignite a fresh rally. Analysts predict that the move from this pattern could push Solana toward the $290-$300 range. However, failure to hold support at $220, the lower boundary of the pennant, could invalidate this bullish outlook. However, with the RSI moving below its signal line with a rating of 53, the bullish momentum may be dwindling.
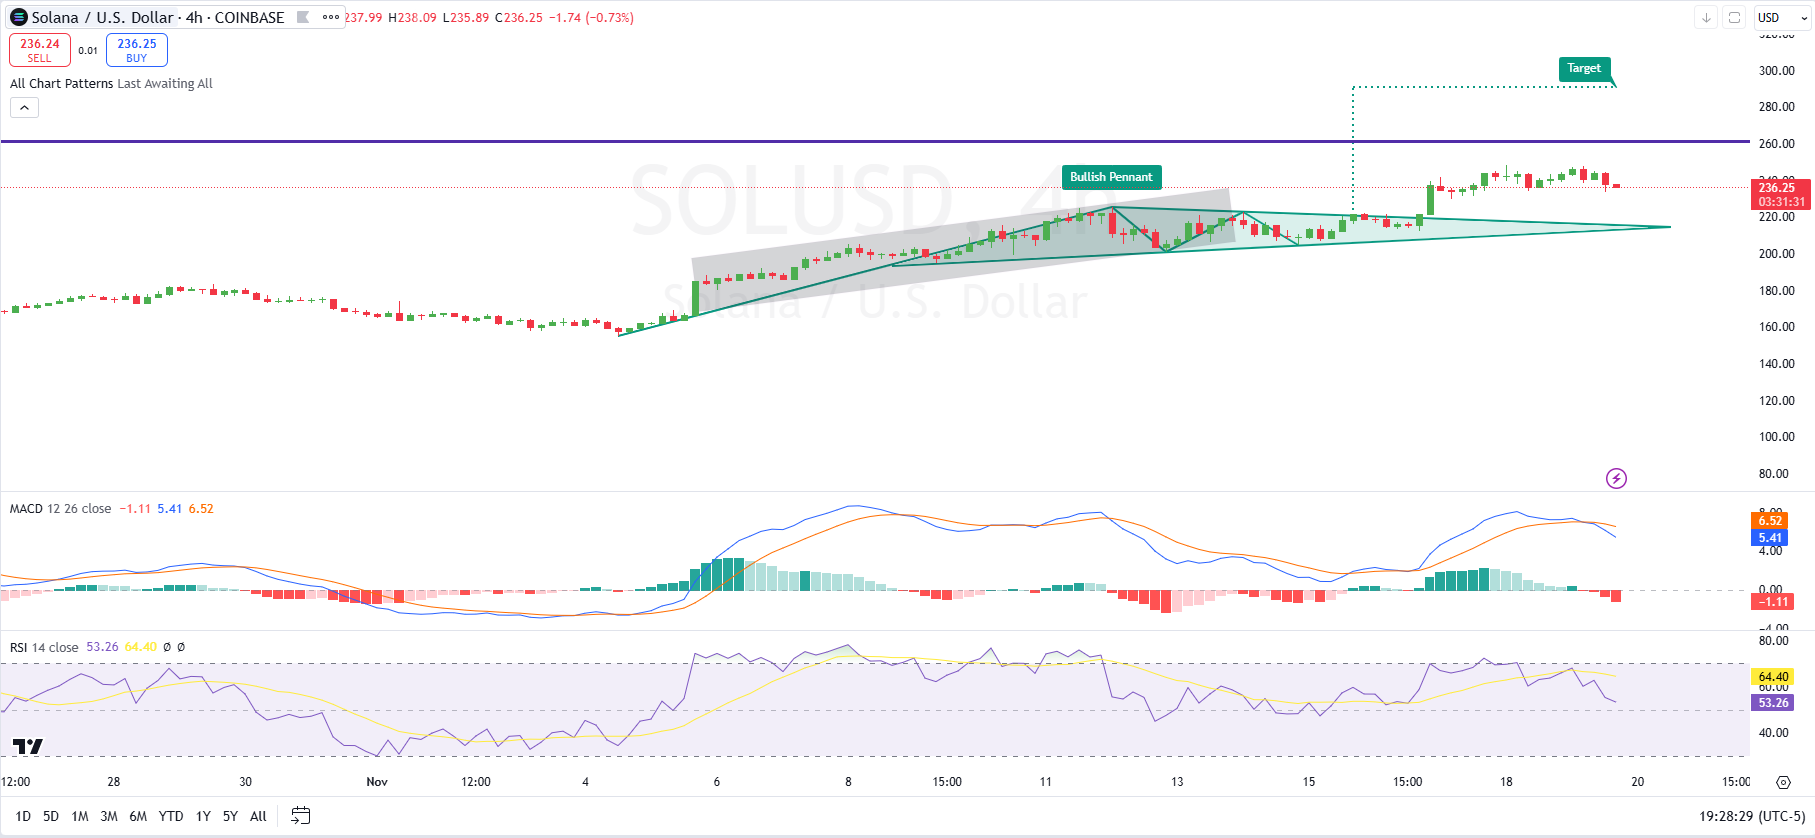
Moreover, the MACD blue line has made a bearish crossover which is a sign of waning bull rally. The histogram has alos shifted into the negative region hinting at increased selling pressure in fear of more SOL price dips.
More Crypto Online, a crypto market analyst, commented,
“The bullish pennant pattern suggests the rally could extend into new all-time highs if Solana clears the $260 level convincingly.”
Analysts Eye Key Levels for Breakout
Market analysts are closely watching Solana’s price as it hovers near key resistance levels. More Crypto Online, a crypto analyst, noted that Solana is “following a 5-wave cycle” and could soon target $360 in the coming months. They added that a break below $212 could signal a larger pullback, but the overall structure remains bullish.
Furthermore, historical price patterns indicate that SOL price could follow a trajectory similar to its 2021 rally, which led to massive gains. Miles Deutscher, a crypto market observer, tweeted, “Solana is repeating the same pattern from 2021, which could take it to $780 in the longer term.”
While the current price hovers below its all-time high of $260, analysts believe that a breakout above this level could lead to rapid price discovery, with targets set at $276 and beyond.
The post How Much Could Solana Price Rise This Week? appeared first on CoinGape.


