
Shiba Inu price has underperformed other popular meme coins in the past few days. SHIB trades at $0.000026 on Monday, where it has been stuck since November 10, as investors anticipate more upside as the burn rate rebounds.
Shiba Inu Price Likely to Rally 76% As 6.8m SHIB Burnt
One potential catalyst for the SHIB price is that the number of coins in circulation continues to drop, helped by the robust token burn. Data by Shiburn shows that the amount of these burns rose by 40% in the past 24 hours to 4.85 million.
Therefore, the number of Shiba Inu tokens has continued to drop from the original 999 trillion to 410 trillion, a figure that will continue falling in the future. The token burn is when SHIB coins are moved to an inaccessible wallet either voluntarily or from ecosystem fees to be removed from the circulating supply forever.
These token burns help to create value for existing tokens by reducing the number of coins in circulation. It is often compared to when a company executes a share buyback, which in turn increases the earnings per share.
Some of the top players in this ecosystem are ShibaSwap and Shibarium. ShibaSwap is a decentralized DEX network where people swap tokens, while Shibarium is a layer-2 network that has completed over 500 million transactions. Data on its website shows that ShibaSwap’s volume has jumped to $75 million this month, the highest level since March.

SHIB Price Analysis: Shiba Inu Bulls Prepares For Uptrend
In an X post, Shib Knight, a popular crypto analyst predicted that the SHIB was preparing for its next leg and that it looked “sendy”.
The most bullish case for the Shiba Inu price rally is a cup-and-handle pattern on the daily chart. This techncial formation contains a rounded bottom that looks like a cup, which is often followed by a minor retracement that forms the handle. Hence, the namesake.
The target of $0.000045 for this setup is obtained by measuring the depth of the cup and adding it to the neckline, connecting the cup and handle’s swing highs.
The upper side of this pattern is at $0.000030, where it has struggled to move above since May. According to this pattern, the ongoing consolidation is part of the formation of a handle section. In most periods, this pattern is one of the most bullish patterns in the market.
Additionally, Shiba Inu price has formed a golden cross pattern as the 50-day and 200-day Exponential Moving Averages (EMA) have formed a bullish crossover. Therefore, the confirmation for the next leg up will come if the SHIB rises above the upper side of the cup at $0.000030. If this happens, SHIB could jump to $0.000045, its highest level this year, which is about 76% above the current level.
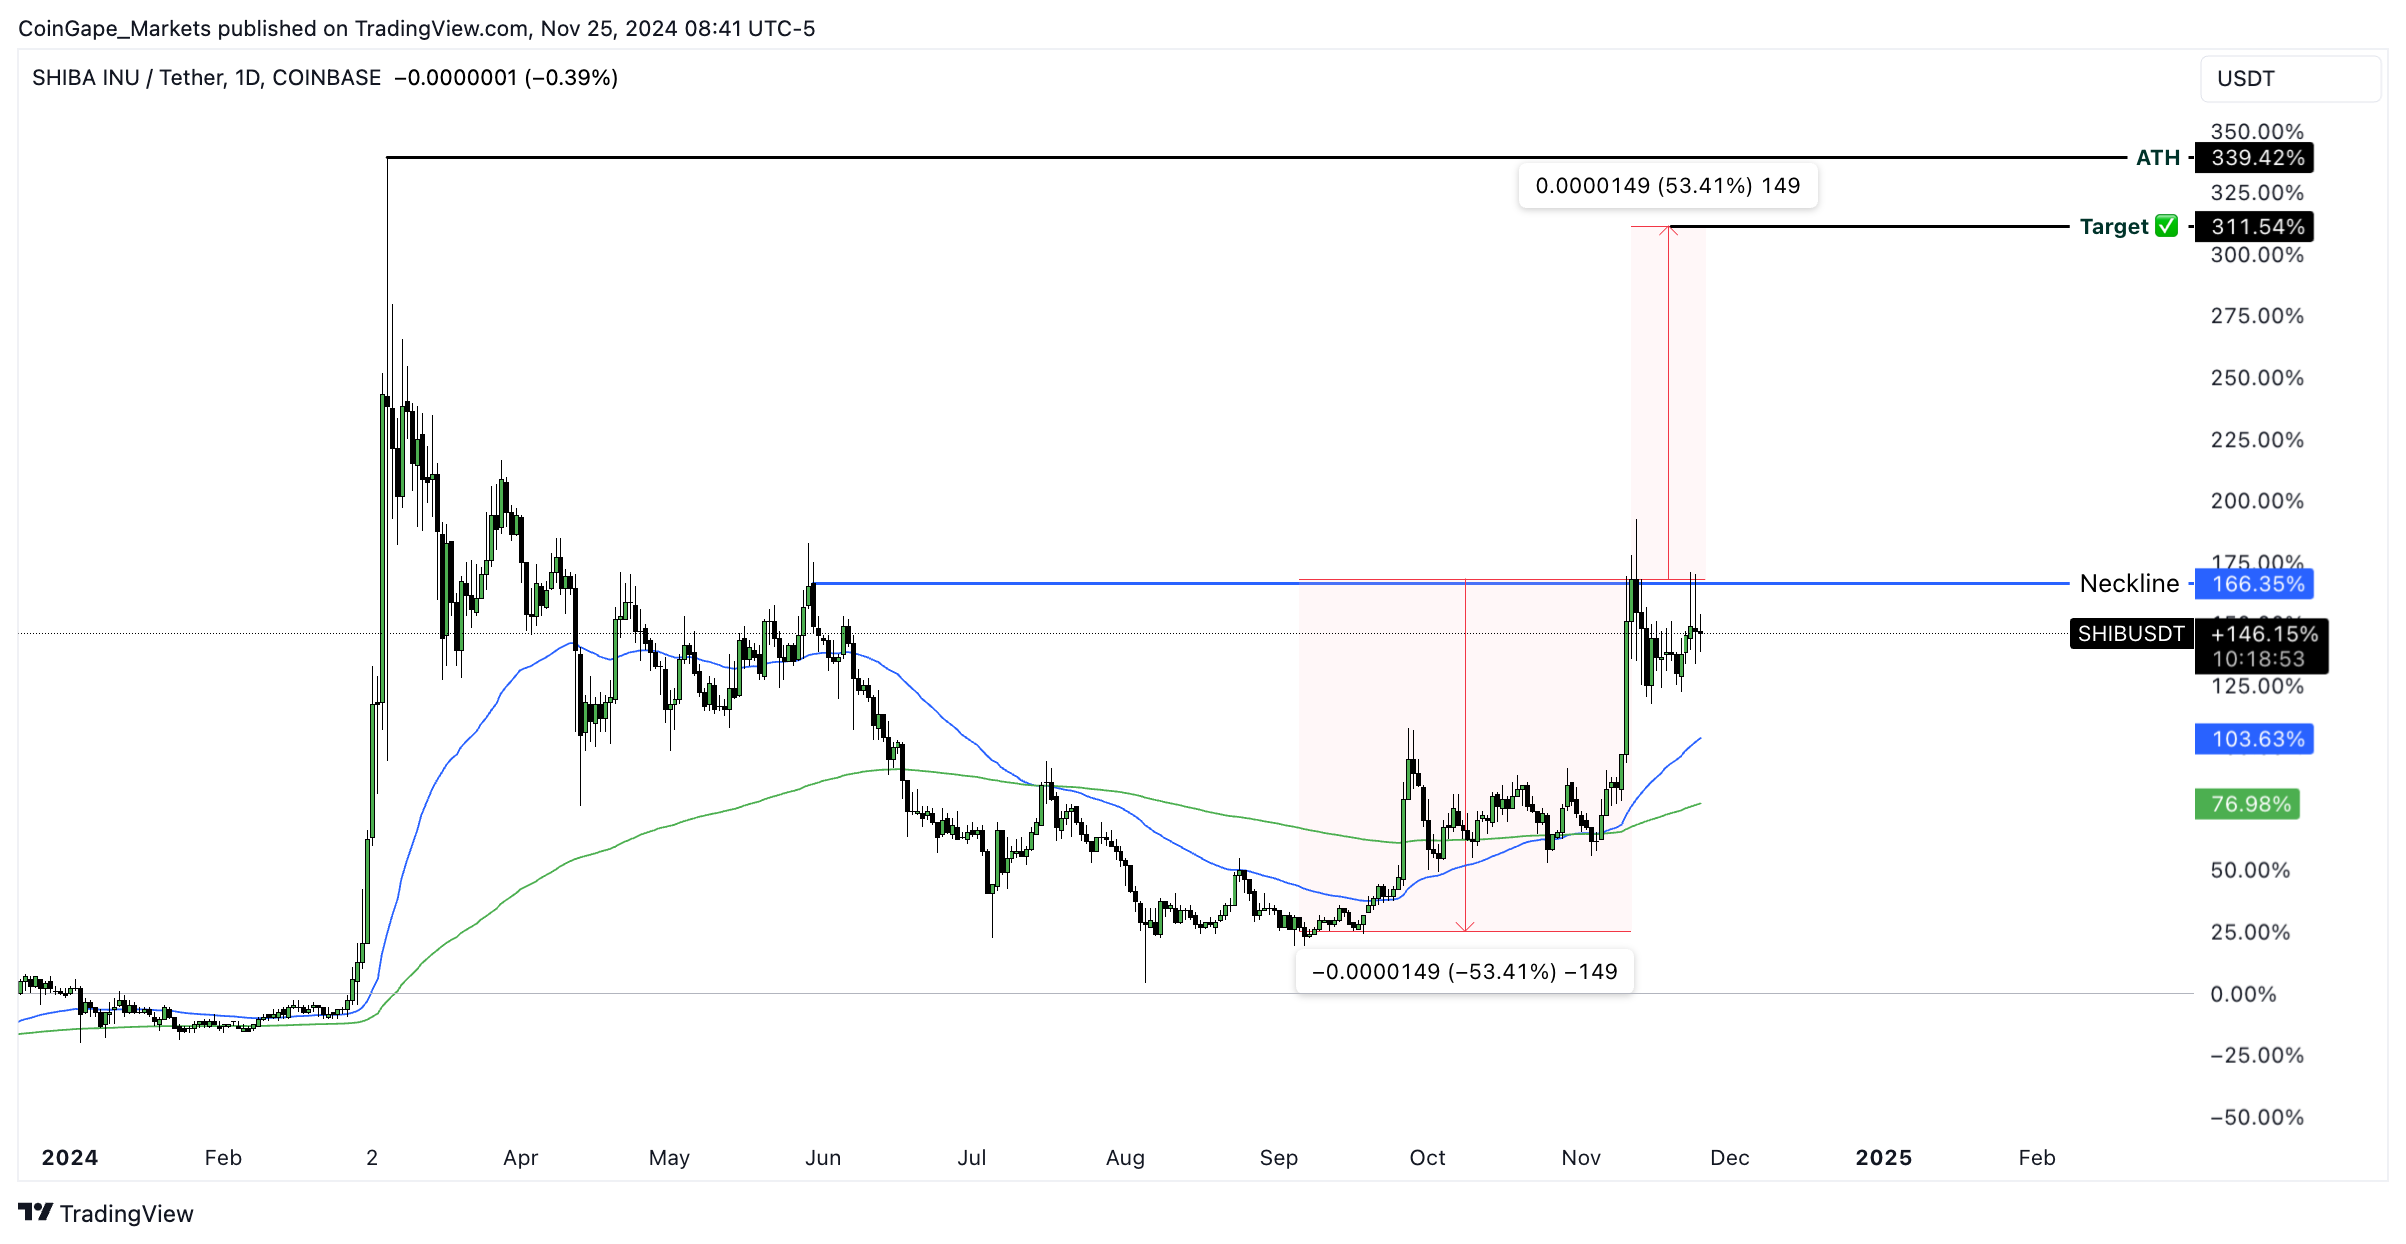
On the flip side, this Shiba Inu price prediction will become invalid if the coin drops below the key psychological point at $0.000023. A drop below that level will point to more downside, potentially to $0.0000158, its lowest point on October 25.
The post Shiba Inu Price Eyes 76% Rally As 6.8m SHIB Tokens Burned appeared first on CoinGape.


