
XLM price has been on a steep ascent since mid-November. However, that momentum was briefly interrupted over the weekend as the wider crypto market followed Bitcoin’s downward cue. Nonetheless, the market returned to the upside on Wednesday, with Stellar breaking out of a bullish flag pattern. We discuss why this could be a pathway to the $1 mark.
XLM Price Triggers Parabolic Rally to $1
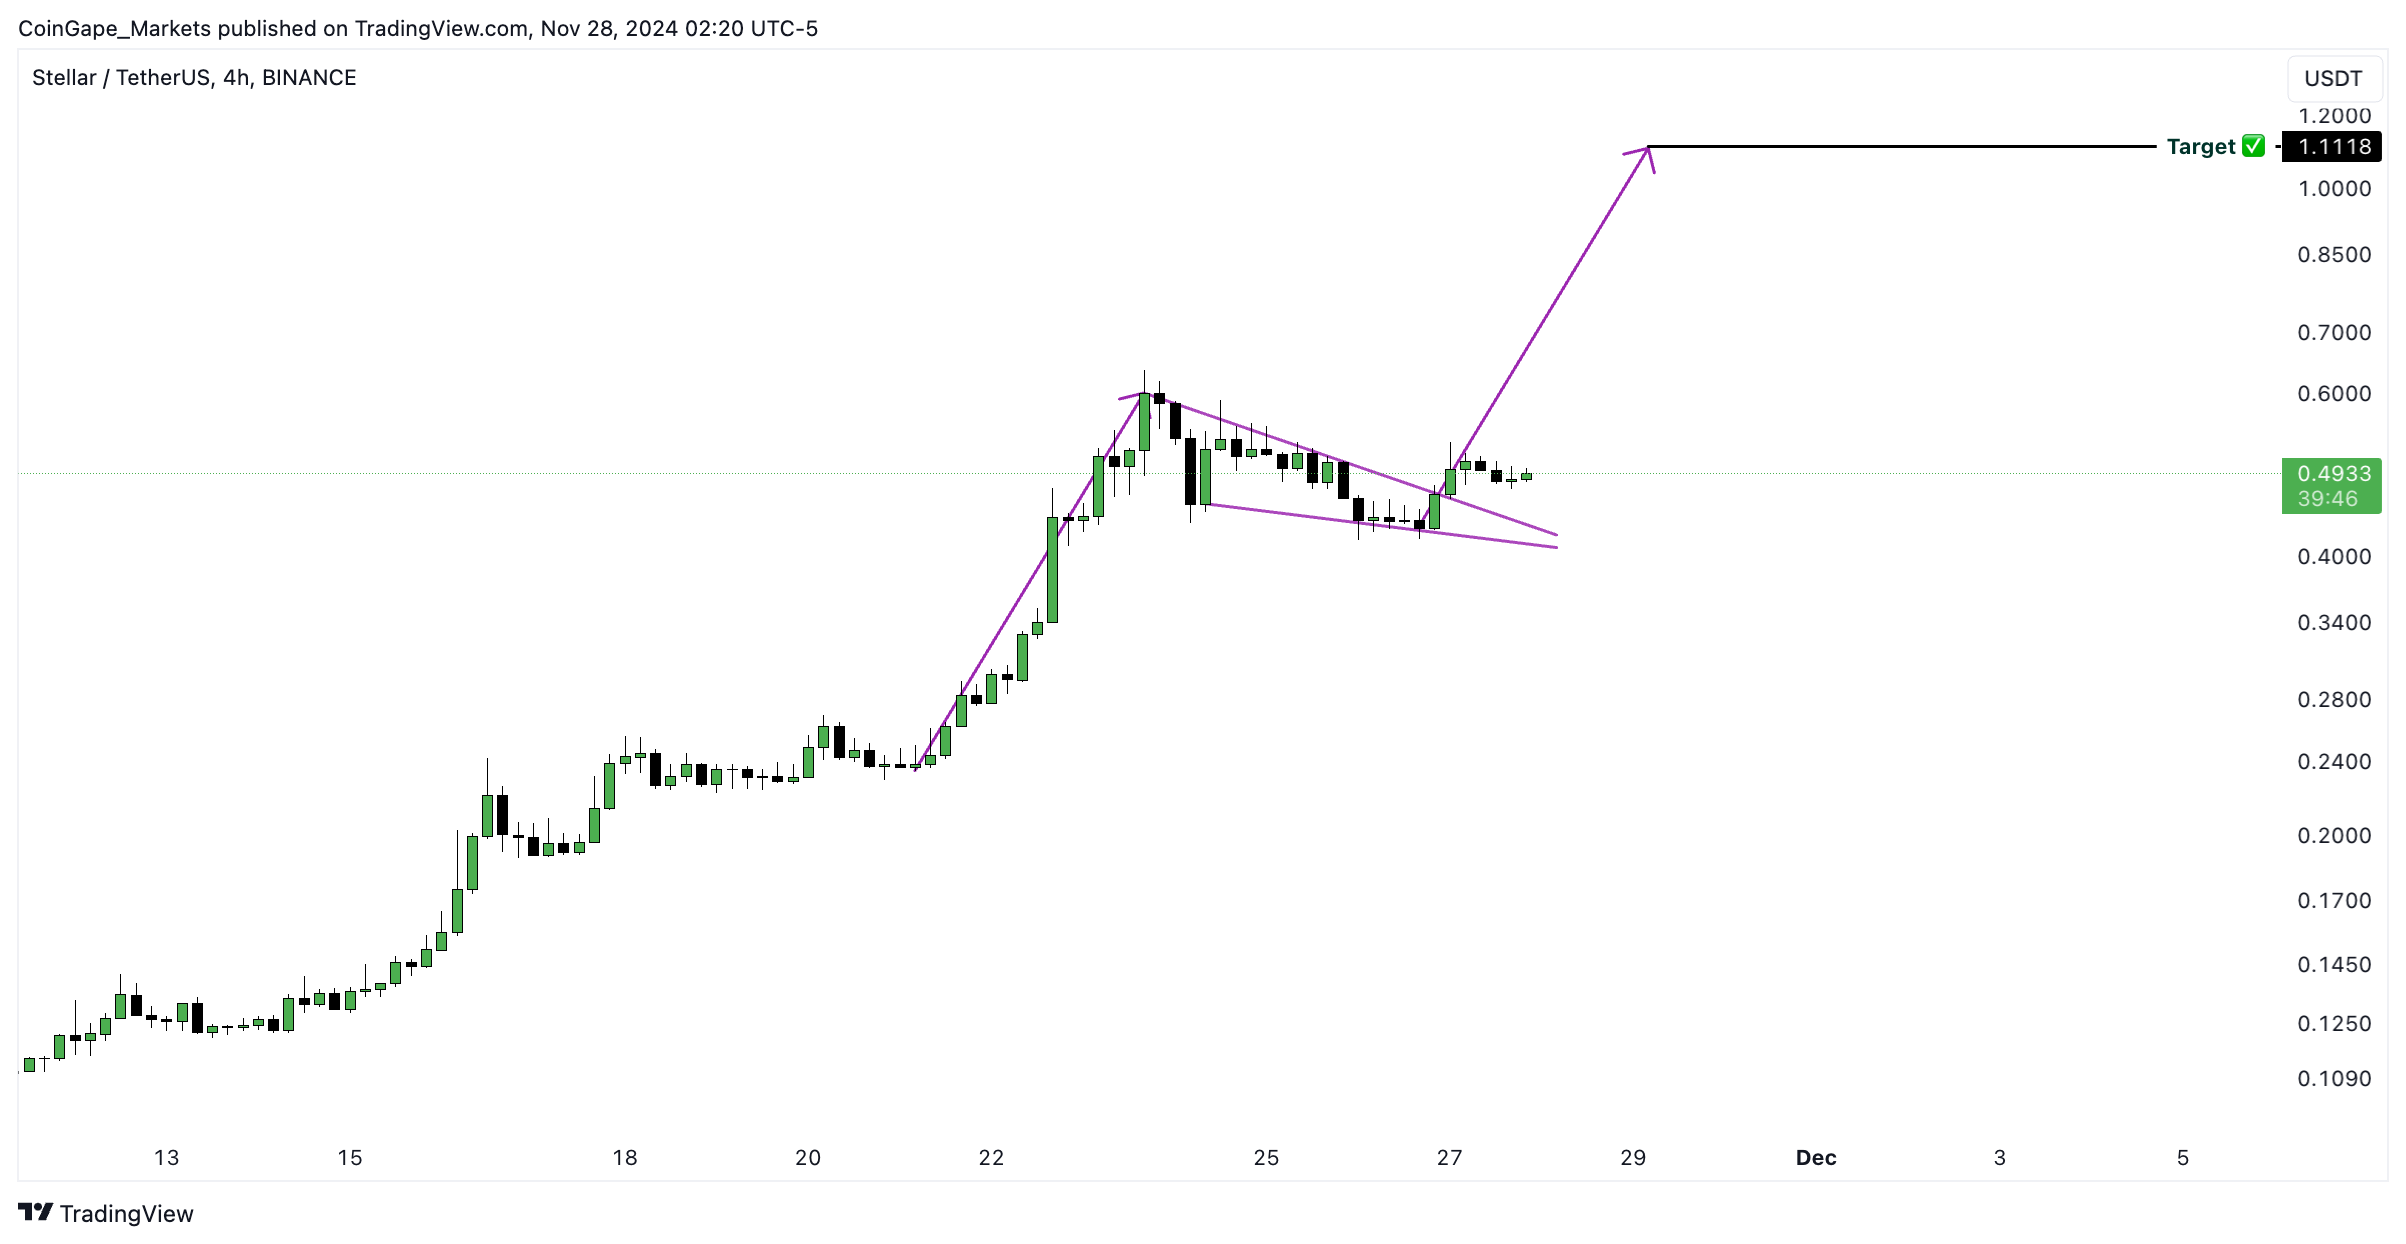
Consolidation phases typically follow exponential price gains like the one recently seen on Stellar price. The brief period of profit-taking is what forms the “flag.” In a market rally, a breakout from the flag pattern signals a return to the previous upward trajectory. In the case of XLM, the breakout happened on Wednesday, and a successive price gain on Thursday added credence to the bullish continuation pattern.
To get the price target in a bullish flag pattern, we measure the “flagpole,” which is the distance from the lows of the upward move to the highs at the flag’s formation point. We then use the same measurement to extrapolate to the upper target, starting from the flag’s lower trendline. Applying this method on the four-hour XLM price prediction chart below signals that the price could go as high as $1.11
Besides the technical outlook’s leaning toward the upside, a number of on-chain metrics also signal bullish control of the market, as discussed below.
Rising Open Interest Signals Increased Demand for XLM
Open Interest measures the value of options or futures contracts that are yet to expire, or investors are yet to exercise/close. In XLM’s case, the value of Open Interest in perpetual contracts rose by 3.2% in the 24 hours preceding this writing, as seen on the graphic below. That signals that more investors are predicting that the value of XLM will continue to rise in the coming days. This sentiment adds support to the coin’s demand side.

A Sharp Spike in XLM DeFi TVL Highlights Growing Adoption
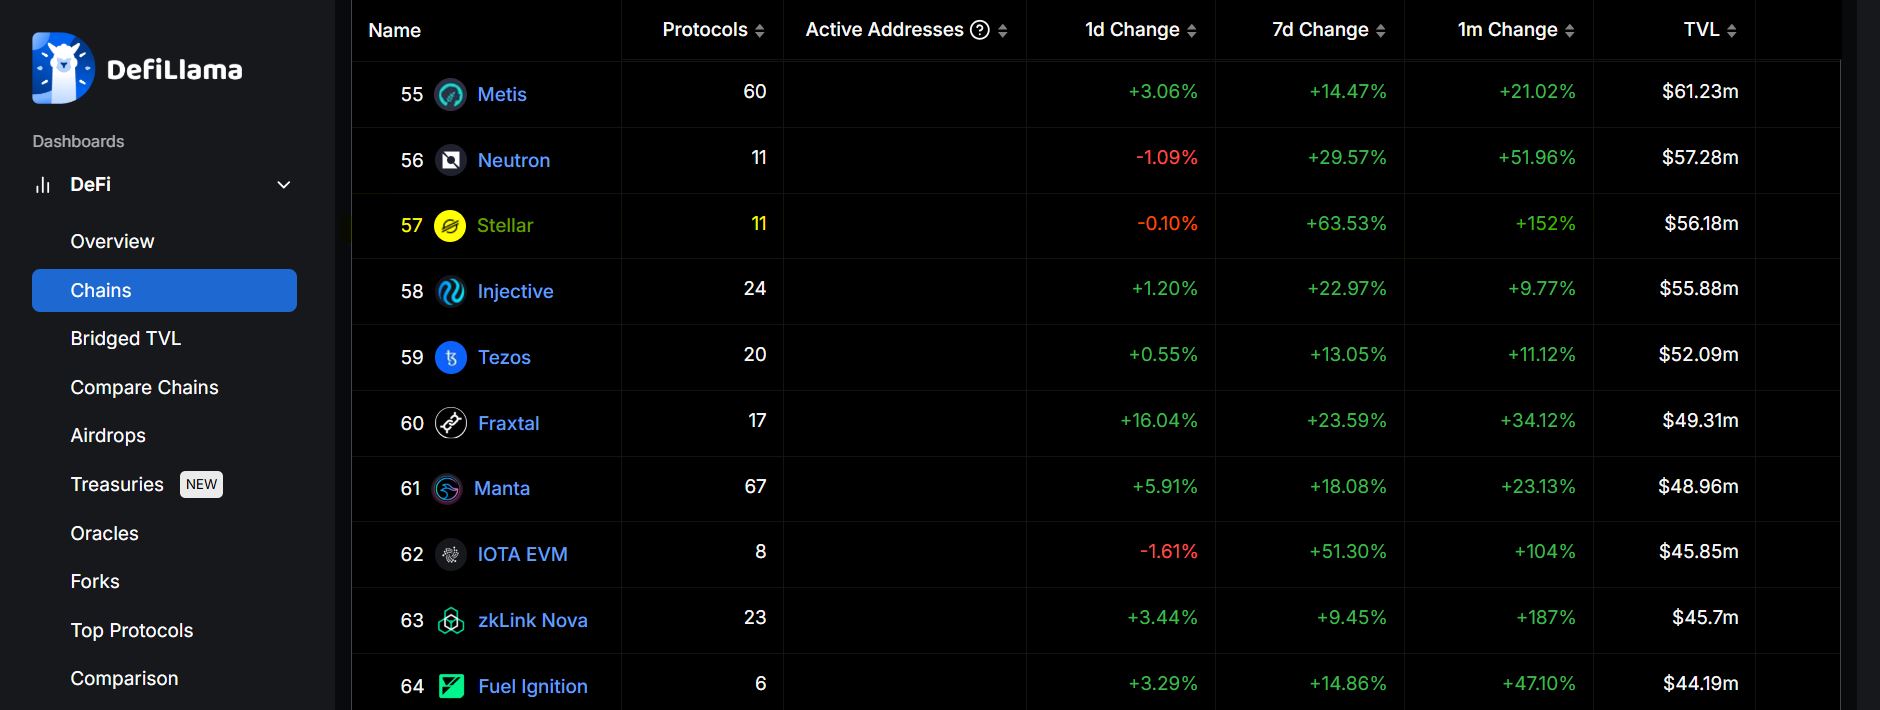
According to recent DeFiLlama data, the Total Value Locked (TVL) in the Stellar chain DeFi ecosystem rose sharply by 63.5% in the last seven days to $56.18 million. That augurs well for XLM price as it points to increased utility in financial transactions.
Stellar Price’s Bullish Momentum Targets $0.50 Support
The RSI indicator reading is at 53, signaling a stronger upside potential. The next key barrier for XLM price is at $0.50, which is a psychological level. A break above that level will confirm the bullish bias. The coin has its immediate support at $0.48, the lower mark of the recent consolidation.
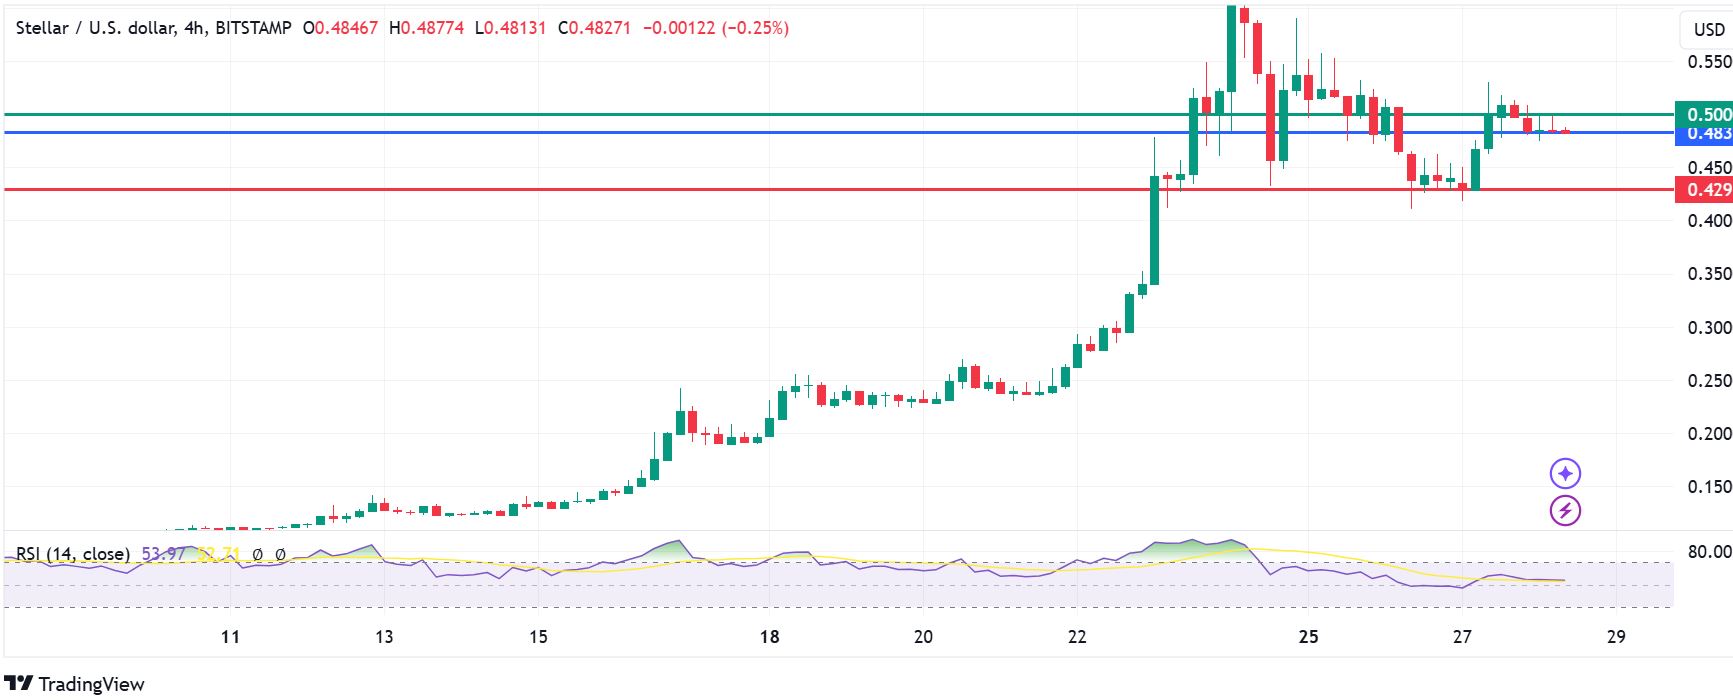
A break below that level will invalidate the upside thesis and potentially open up the path to test $0.40, near the last breakout zone before the parabolic.
The post XLM Price Kickstarts Parabolic Rally to $1 After Recent Breakout appeared first on CoinGape.


