


The Fed’s rate cuts set the real estate world abuzz, with lower mortgage rates giving homebuyers a little more breathing room. According to the Case-Shiller housing data released on Tuesday, home prices rose 5% in August. Nevertheless, Wall Street expects demand to increase slowly.
The proof? Take a look at the market. The Sector Summary Data Panel on your StockCharts Dashboard displays the performance of the S&P 500 sectors. The image below looks at a three-month performance.
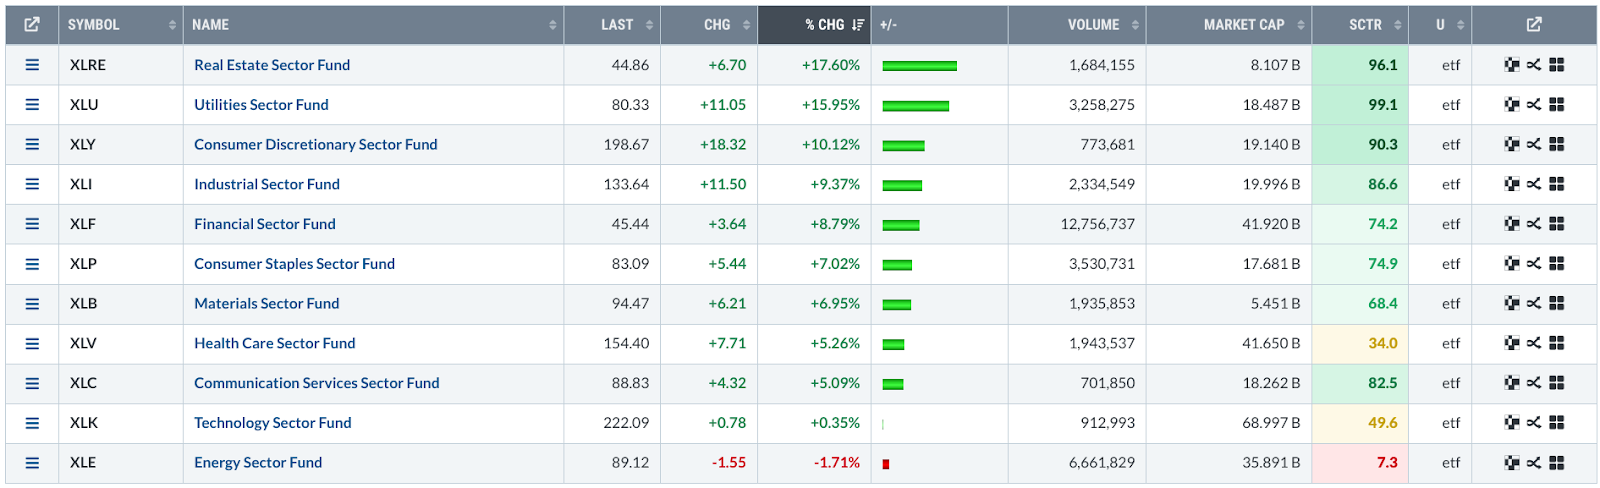
FIGURE 1. SECTOR SUMMARY. Over the last three months, real estate has been the top-performing sector.Image source: StockCharts.com. For educational purposes.
Looking at Real Estate Select Sector SPDR Fund (XLRE) as the sector proxy, you can see that capital has been flowing into real estate stocks over a period of months as Wall Street has been betting on the Fed cutting rates—and it finally happened last week. Below is a weekly chart of XLRE.
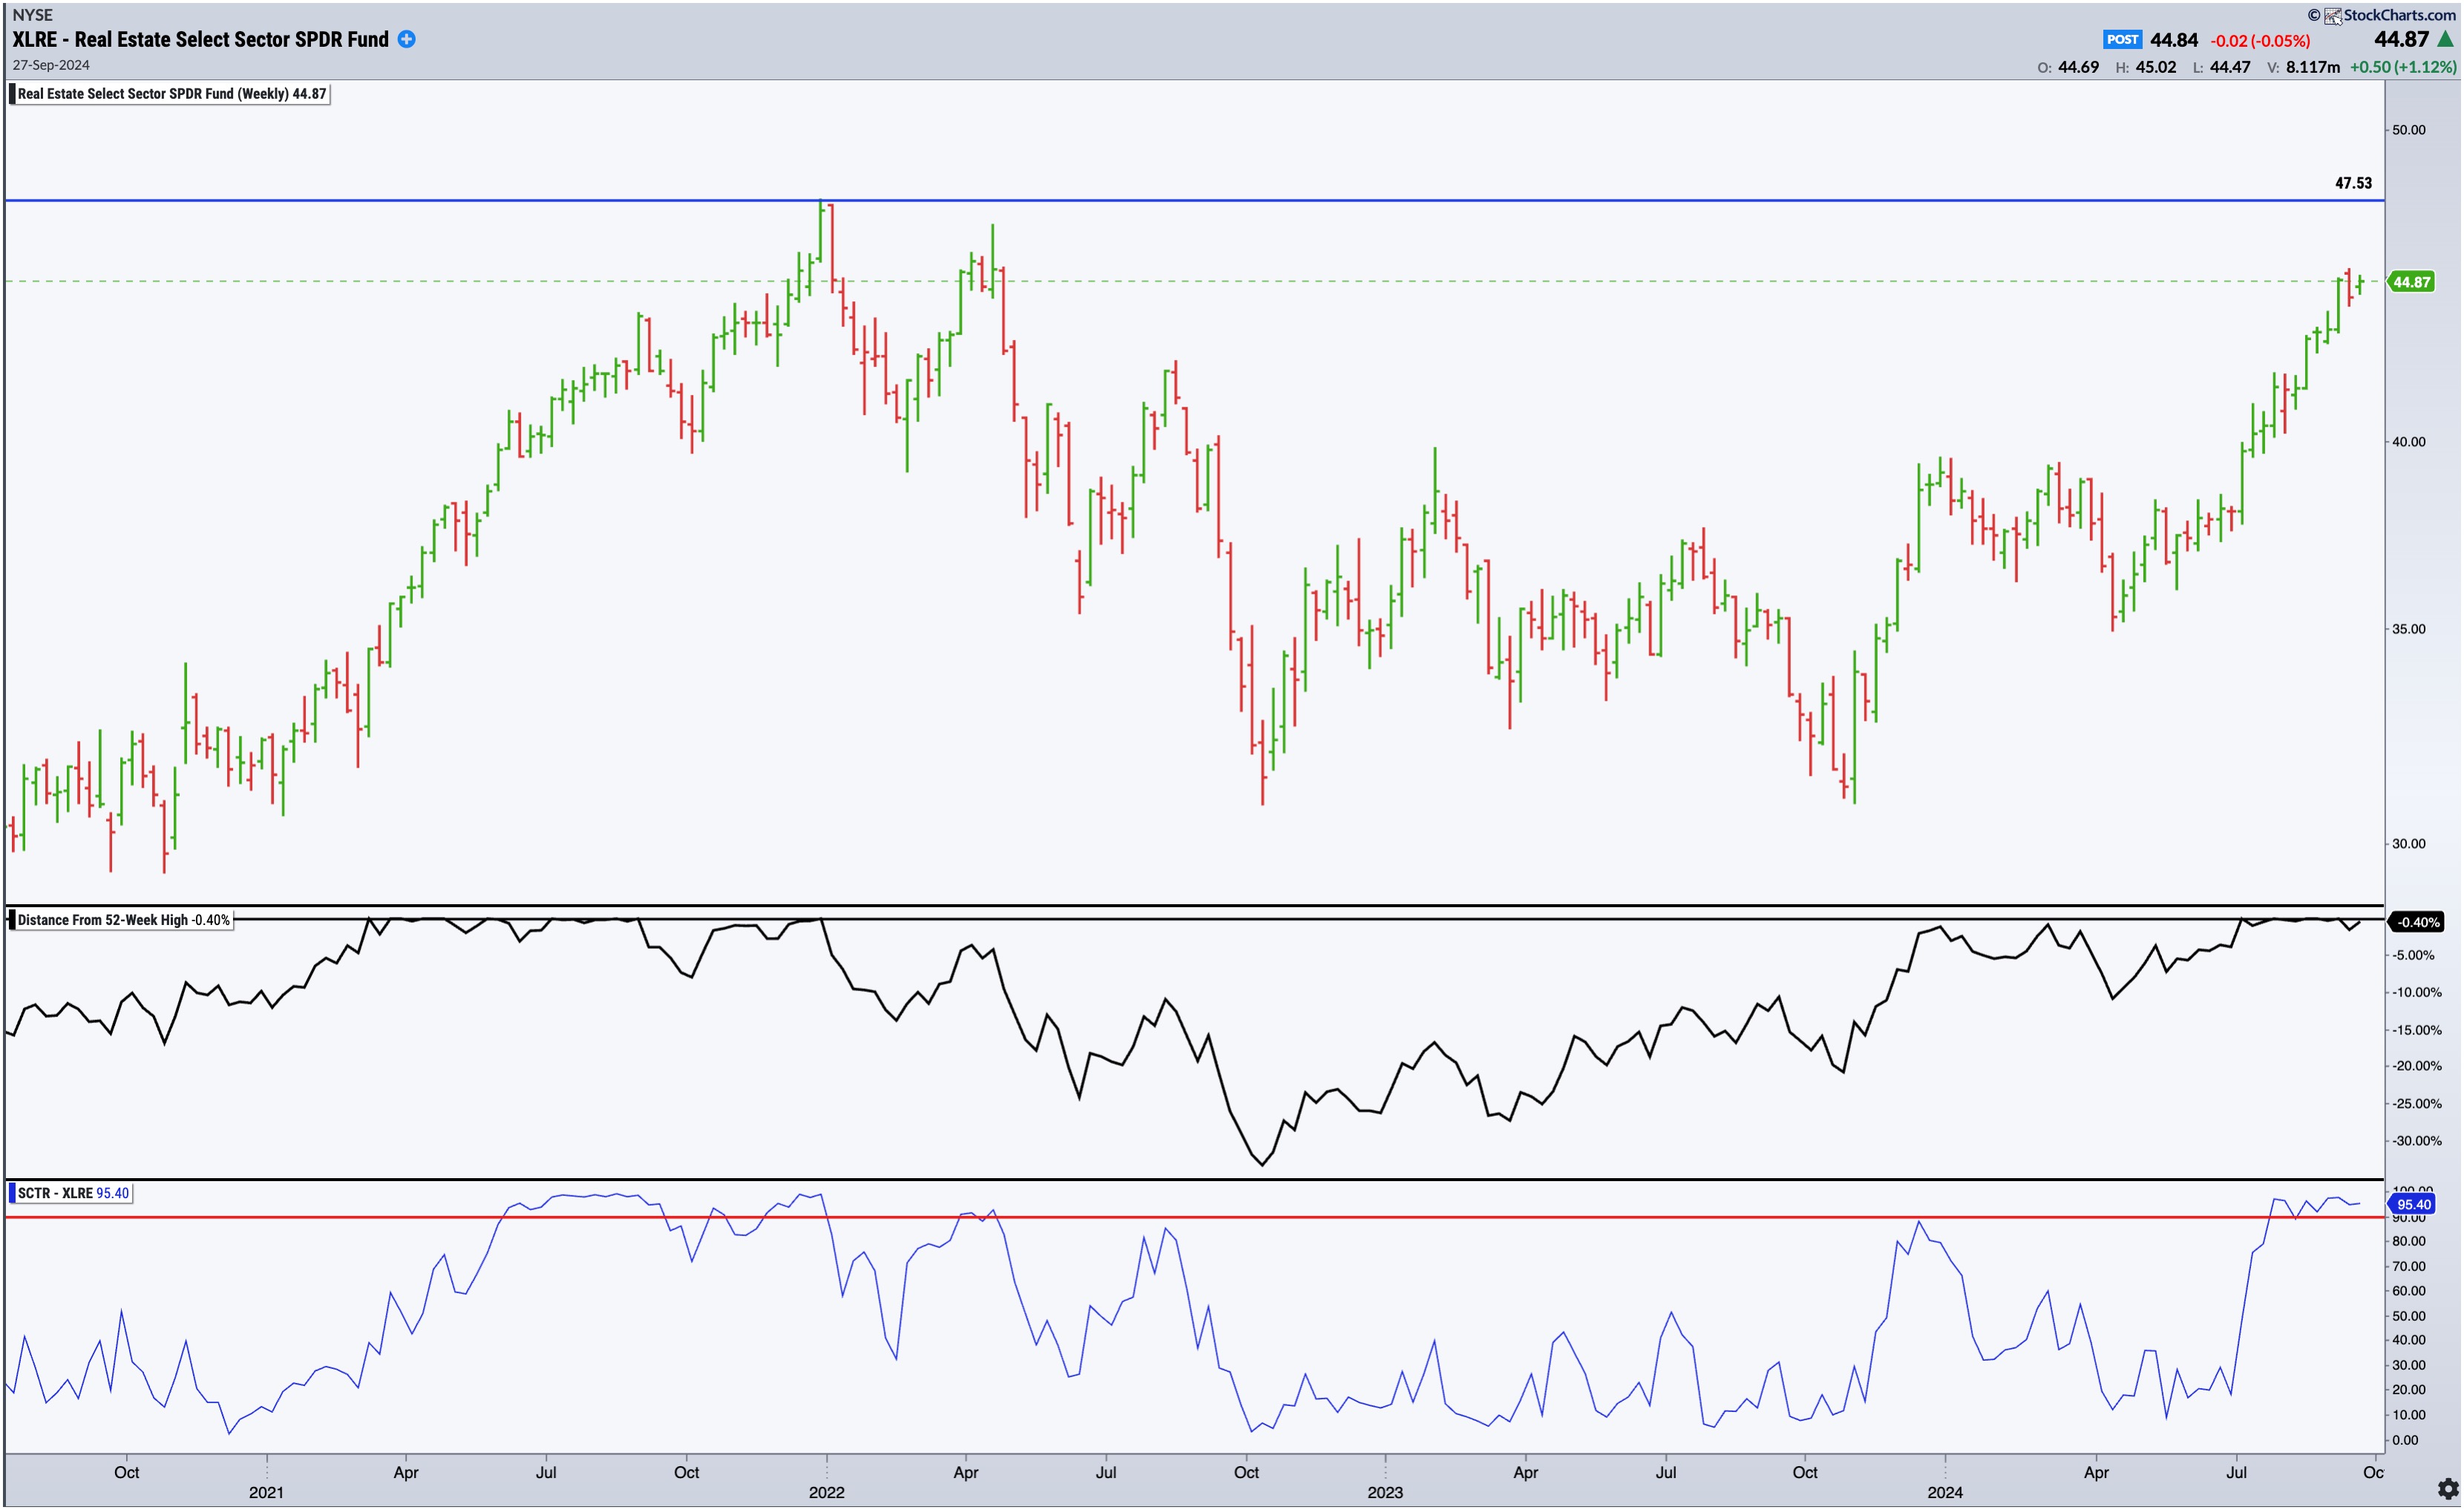
CHART 1. WEEKLY CHART OF XLRE. Note that the Distance From 52-Week Highs indicator, which is available in StockChartsACP, indicates XLRE is very close to its one year high.Chart source: StockChartsACP. For educational purposes.
Note the following details:
- XLRE’s all-time high is at $47.53 (adjusted for dividends), which is not too far from where the ETF is trading.
- Looking at the Distance From Highs indicator, XLRE is about 0.4% below its 52-week high—answering the question “What does Wall Street think of the real estate sector’s prospects in the coming months?”
- The StockCharts Technical Rank (SCTR, pronounced “scooter”) line is currently above the 90 line (see red horizontal line on the SCTR indicator), meaning that multiple indicators are bullish across several timeframes.
XLRE has been on a roll, but the big question is—has the real estate rally run its course, or does it still have enough momentum to breach its 52-week high?
Let’s look at a daily chart of XLRE using SharpCharts.
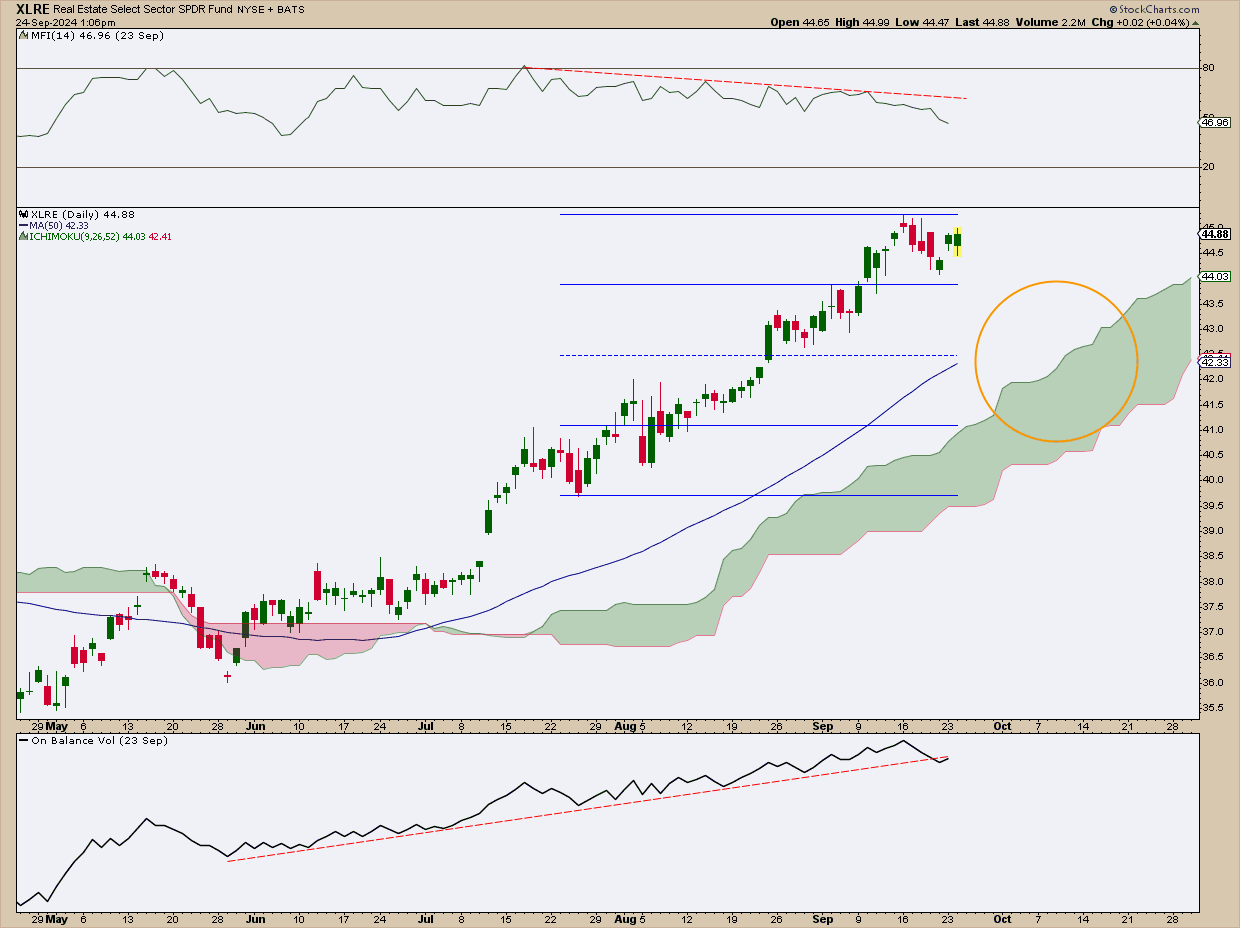
CHART 2. DAILY CHART OF XLRE. There’s lots of space to pull back before the uptrend calls it quits.Chart source: StockCharts.com. For educational purposes.
After bottoming out in April, XLRE has been climbing and is just 0.4% away from its 52-week high—$45.04 (adjusted for dividends). Last week’s tiny pullback stayed within the first Quadrant Line, signaling strength.
Signals are mixed, however: while the On Balance Volume (OBV) indicator shows solid buying pressure, the Money Flow Index (MFI), which operates like a volume-weighted Relative Strength Index (RSI), suggests otherwise. With prices rising and buying pressure dropping—a bearish divergence—a short-term dip might be on the horizon. If XLRE falls, look to the area within the orange circle as a wide potential support range. More specifically…
- The 50-day simple moving average (SMA) may climb to the space between the first and second quadrant lines (25% to 50% retracement, respectively); both the 50-day SMA and the first and second quadrants serve as a favorable support area to buy into strength.
- The Ichimoku Cloud, which is currently bullish, projects a deeper range of potential support within the next 26 days. The lowest point currently matches the 75% range of the quadrant line (third quadrant).
- If XLRE falls below the third quadrant, marking a 75% retracement, the current uptrend could be in trouble. In this case, it might be time to pause and reassess the technical and fundamental situation before proceeding with any trades.
Closing Bell
The real estate sector has been riding high before and after the latest Fed’s rate cut. Based on the market action, Wall Street has been bullish. However, momentum seems mixed, hinting at a possible short-term breather. If this occurs, watch key support levels to distinguish strong buying opportunities from danger zones.

Disclaimer: This blog is for educational purposes only and should not be construed as financial advice. The ideas and strategies should never be used without first assessing your own personal and financial situation, or without consulting a financial professional.


