


Apologies for revisiting Carvana (CVNA), but it has such a beautiful chart pattern playing out the way it should. After bottoming out in a cup with handle pattern on the weekly chart and breaking out of the handle, Carvana stock has been in an upward-moving trend. The stock has now hit another milestone level, making it necessary to feature it again.
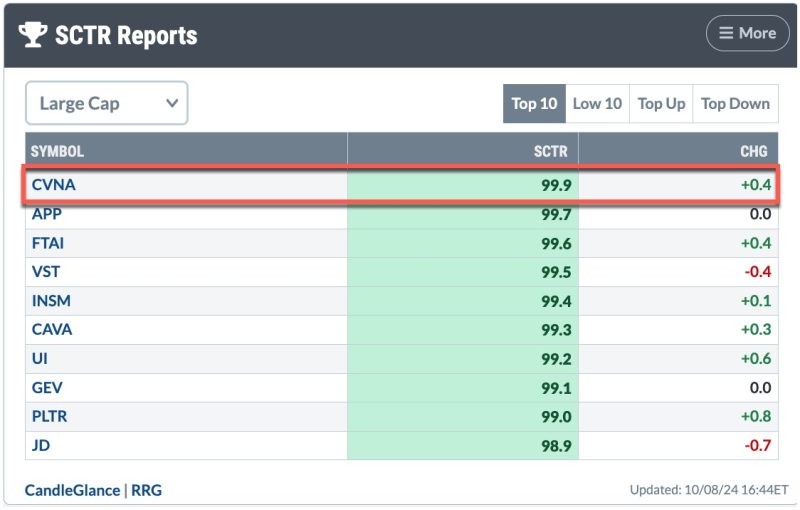
Carvana stock hits a new 52-week high and is back in the top position in the StockCharts Technical Rank (SCTR) Report, Top 10, Large Cap category. Several StockCharts Predefined Scans were also triggered for Carvana (see Symbol Summary page for CVNA). The stock price has been trending higher, with higher highs and higher lows. For a while, CVNA has frequently appeared in the top five in the SCTR Report, and if you follow the ChartWatchers blog, you’d have seen the stock pop up frequently. If you opened a long position in CVNA, you’d be feeling pretty good now.
But don’t get too complacent. It’s time to manage your position. Let’s analyze the recent stock price charts, starting with the weekly chart.
Carvana Stock Weekly Analysis
From a weekly perspective, Carvana’s stock price is maintaining its uptrend; it’s also approaching its 50% Fibonacci retracement level, and its relative strength index (RSI) has just crossed the 70 level. The uptrend is still intact and could go much higher if the momentum is behind it.
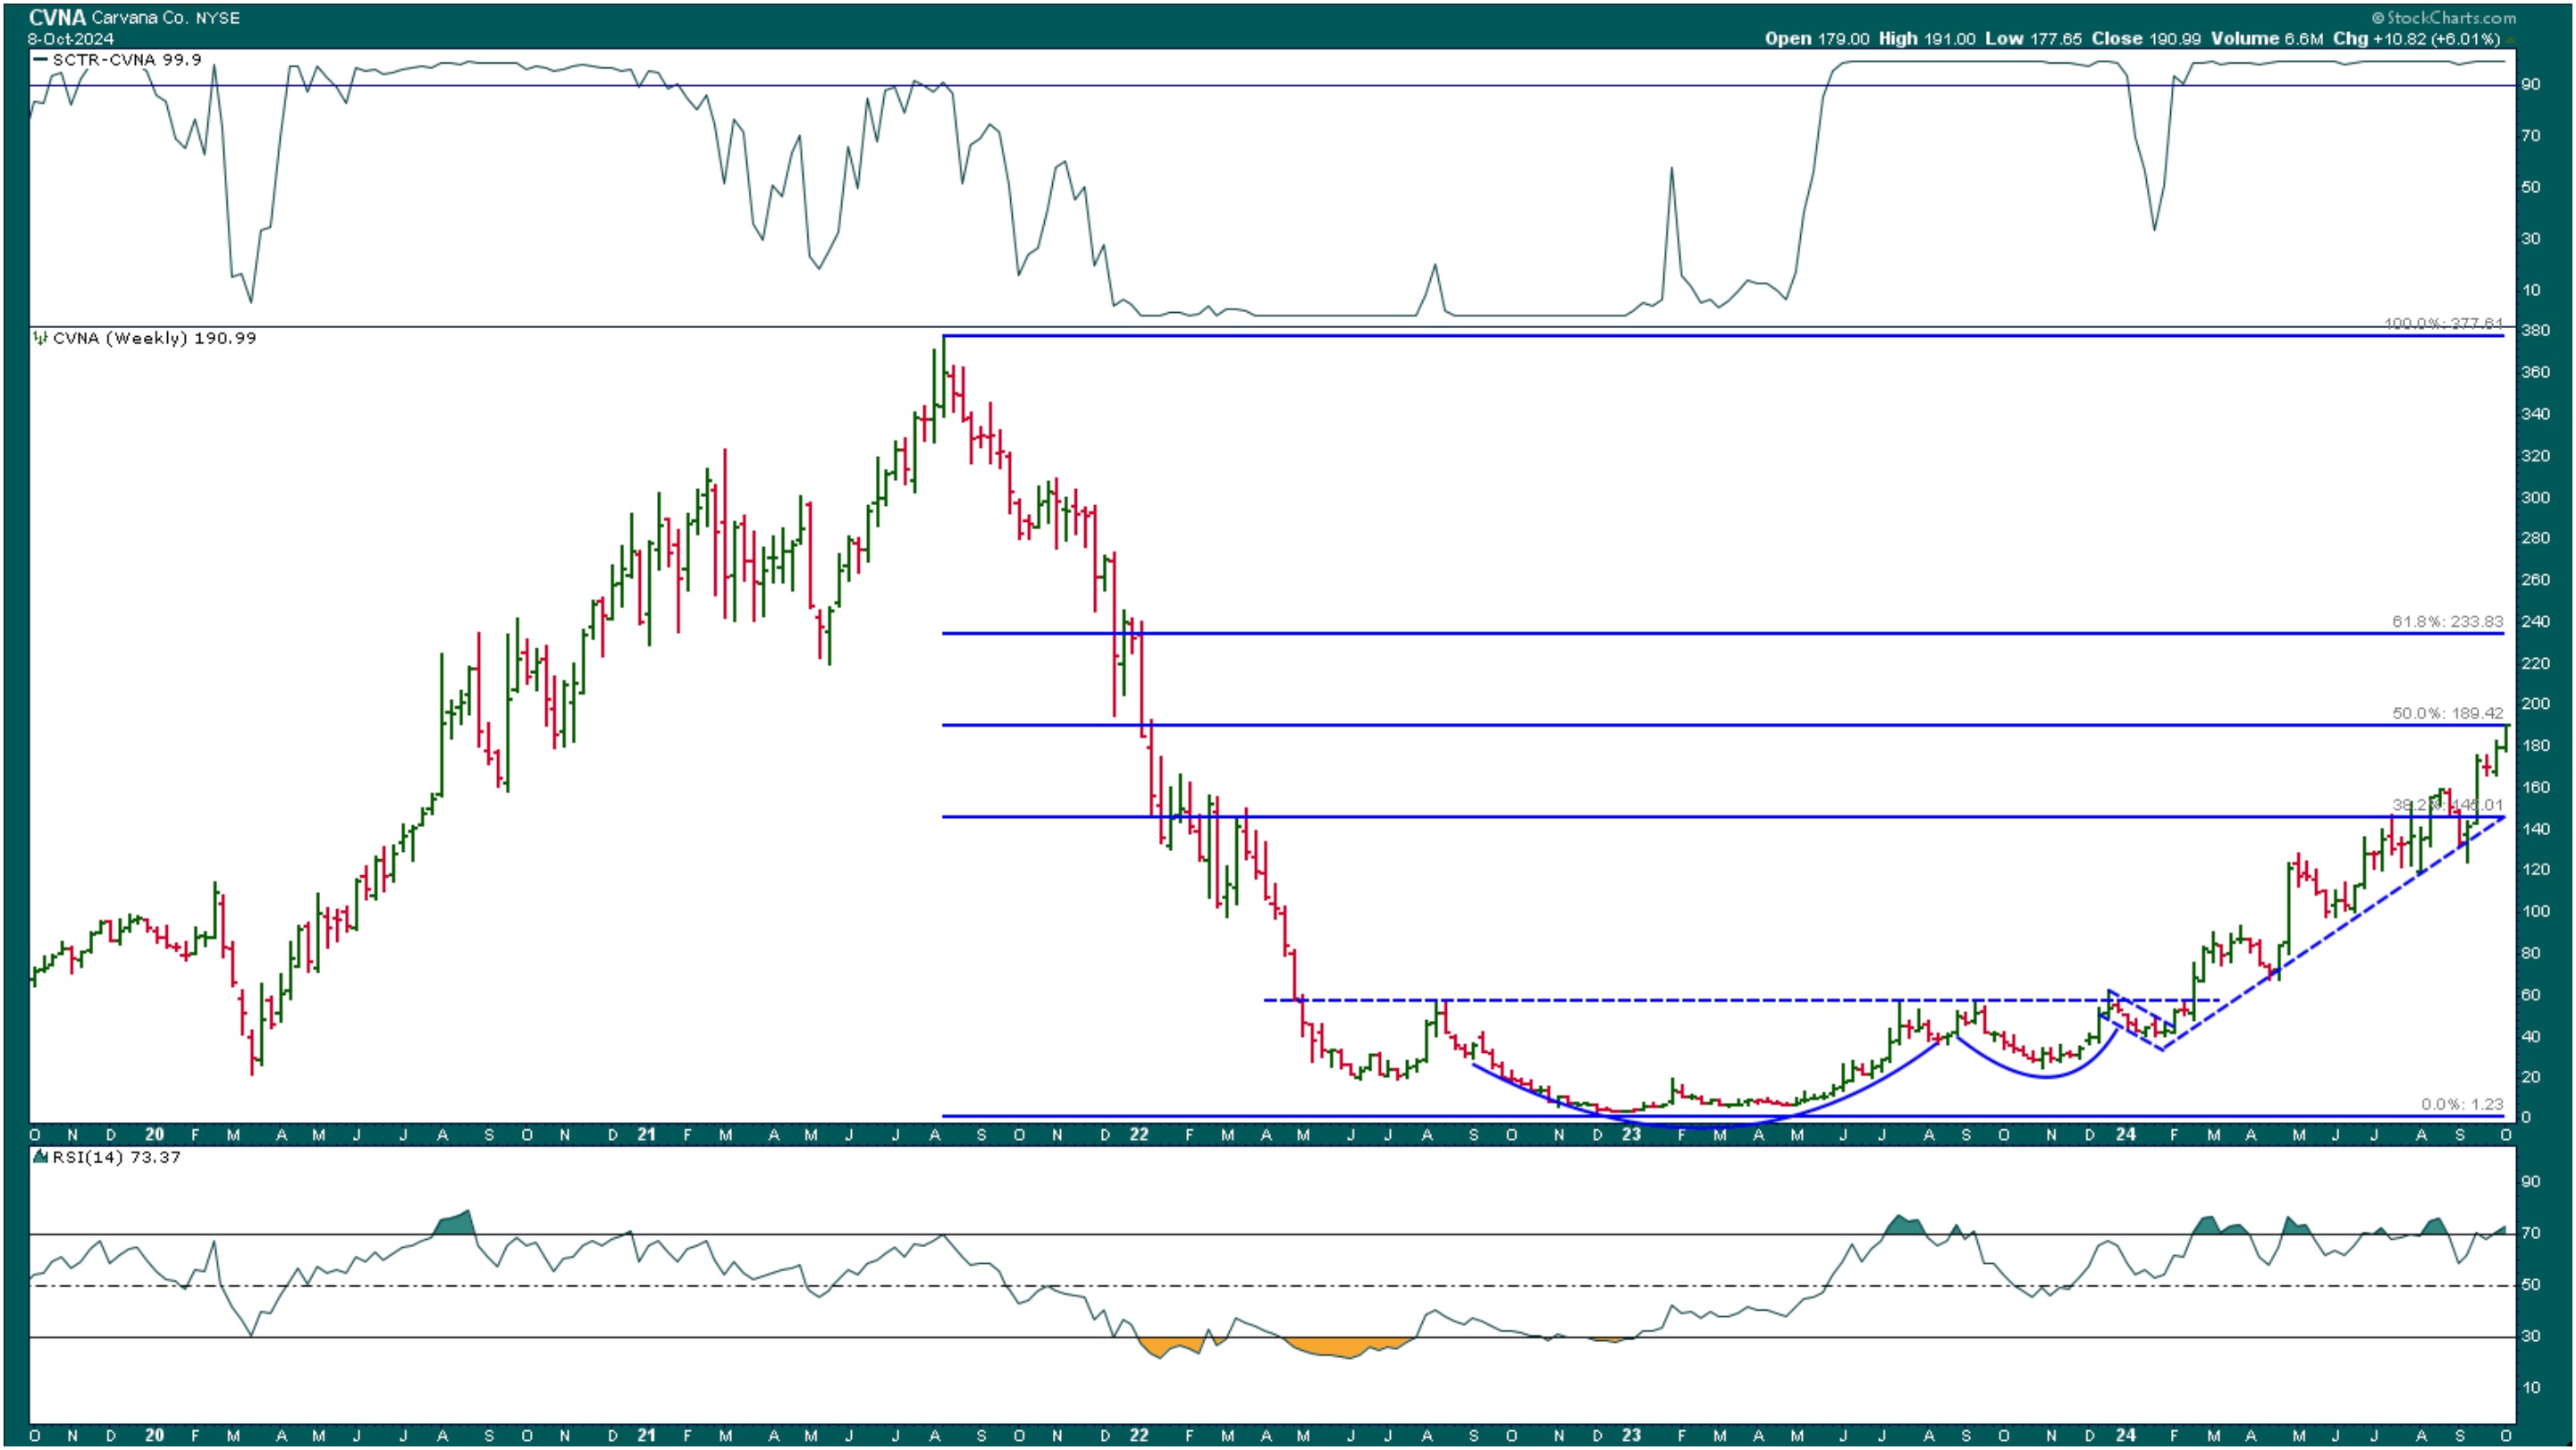
CHART 1. CARVANA STOCK CONTINUES TRENDING HIGHER. After breaking out of a cup and handle pattern, CVNA is trending higher and is now at its 50% Fibonacci retracement level.Chart source: StockCharts.com. For educational purposes.
I would watch the 50% retracement level carefully. It could act as a resistance level, causing the stock price to stall. As long as it stays within the 38.2 and 50% retracement level, i.e., between $145 and $189.42, the uptrend should be intact. Of course, if CVNA breaks above the 50% retracement level, continue to ride the trend.
Carvana Stock Daily Analysis
When a stock has a well-defined trend, momentum is an important ingredient in fueling the trend higher. The Chaikin Money Flow indicator (top panel) and moving average convergence/divergence (MACD) displayed in the bottom panel show that momentum supports the upmove in Carvana (see daily chart below).
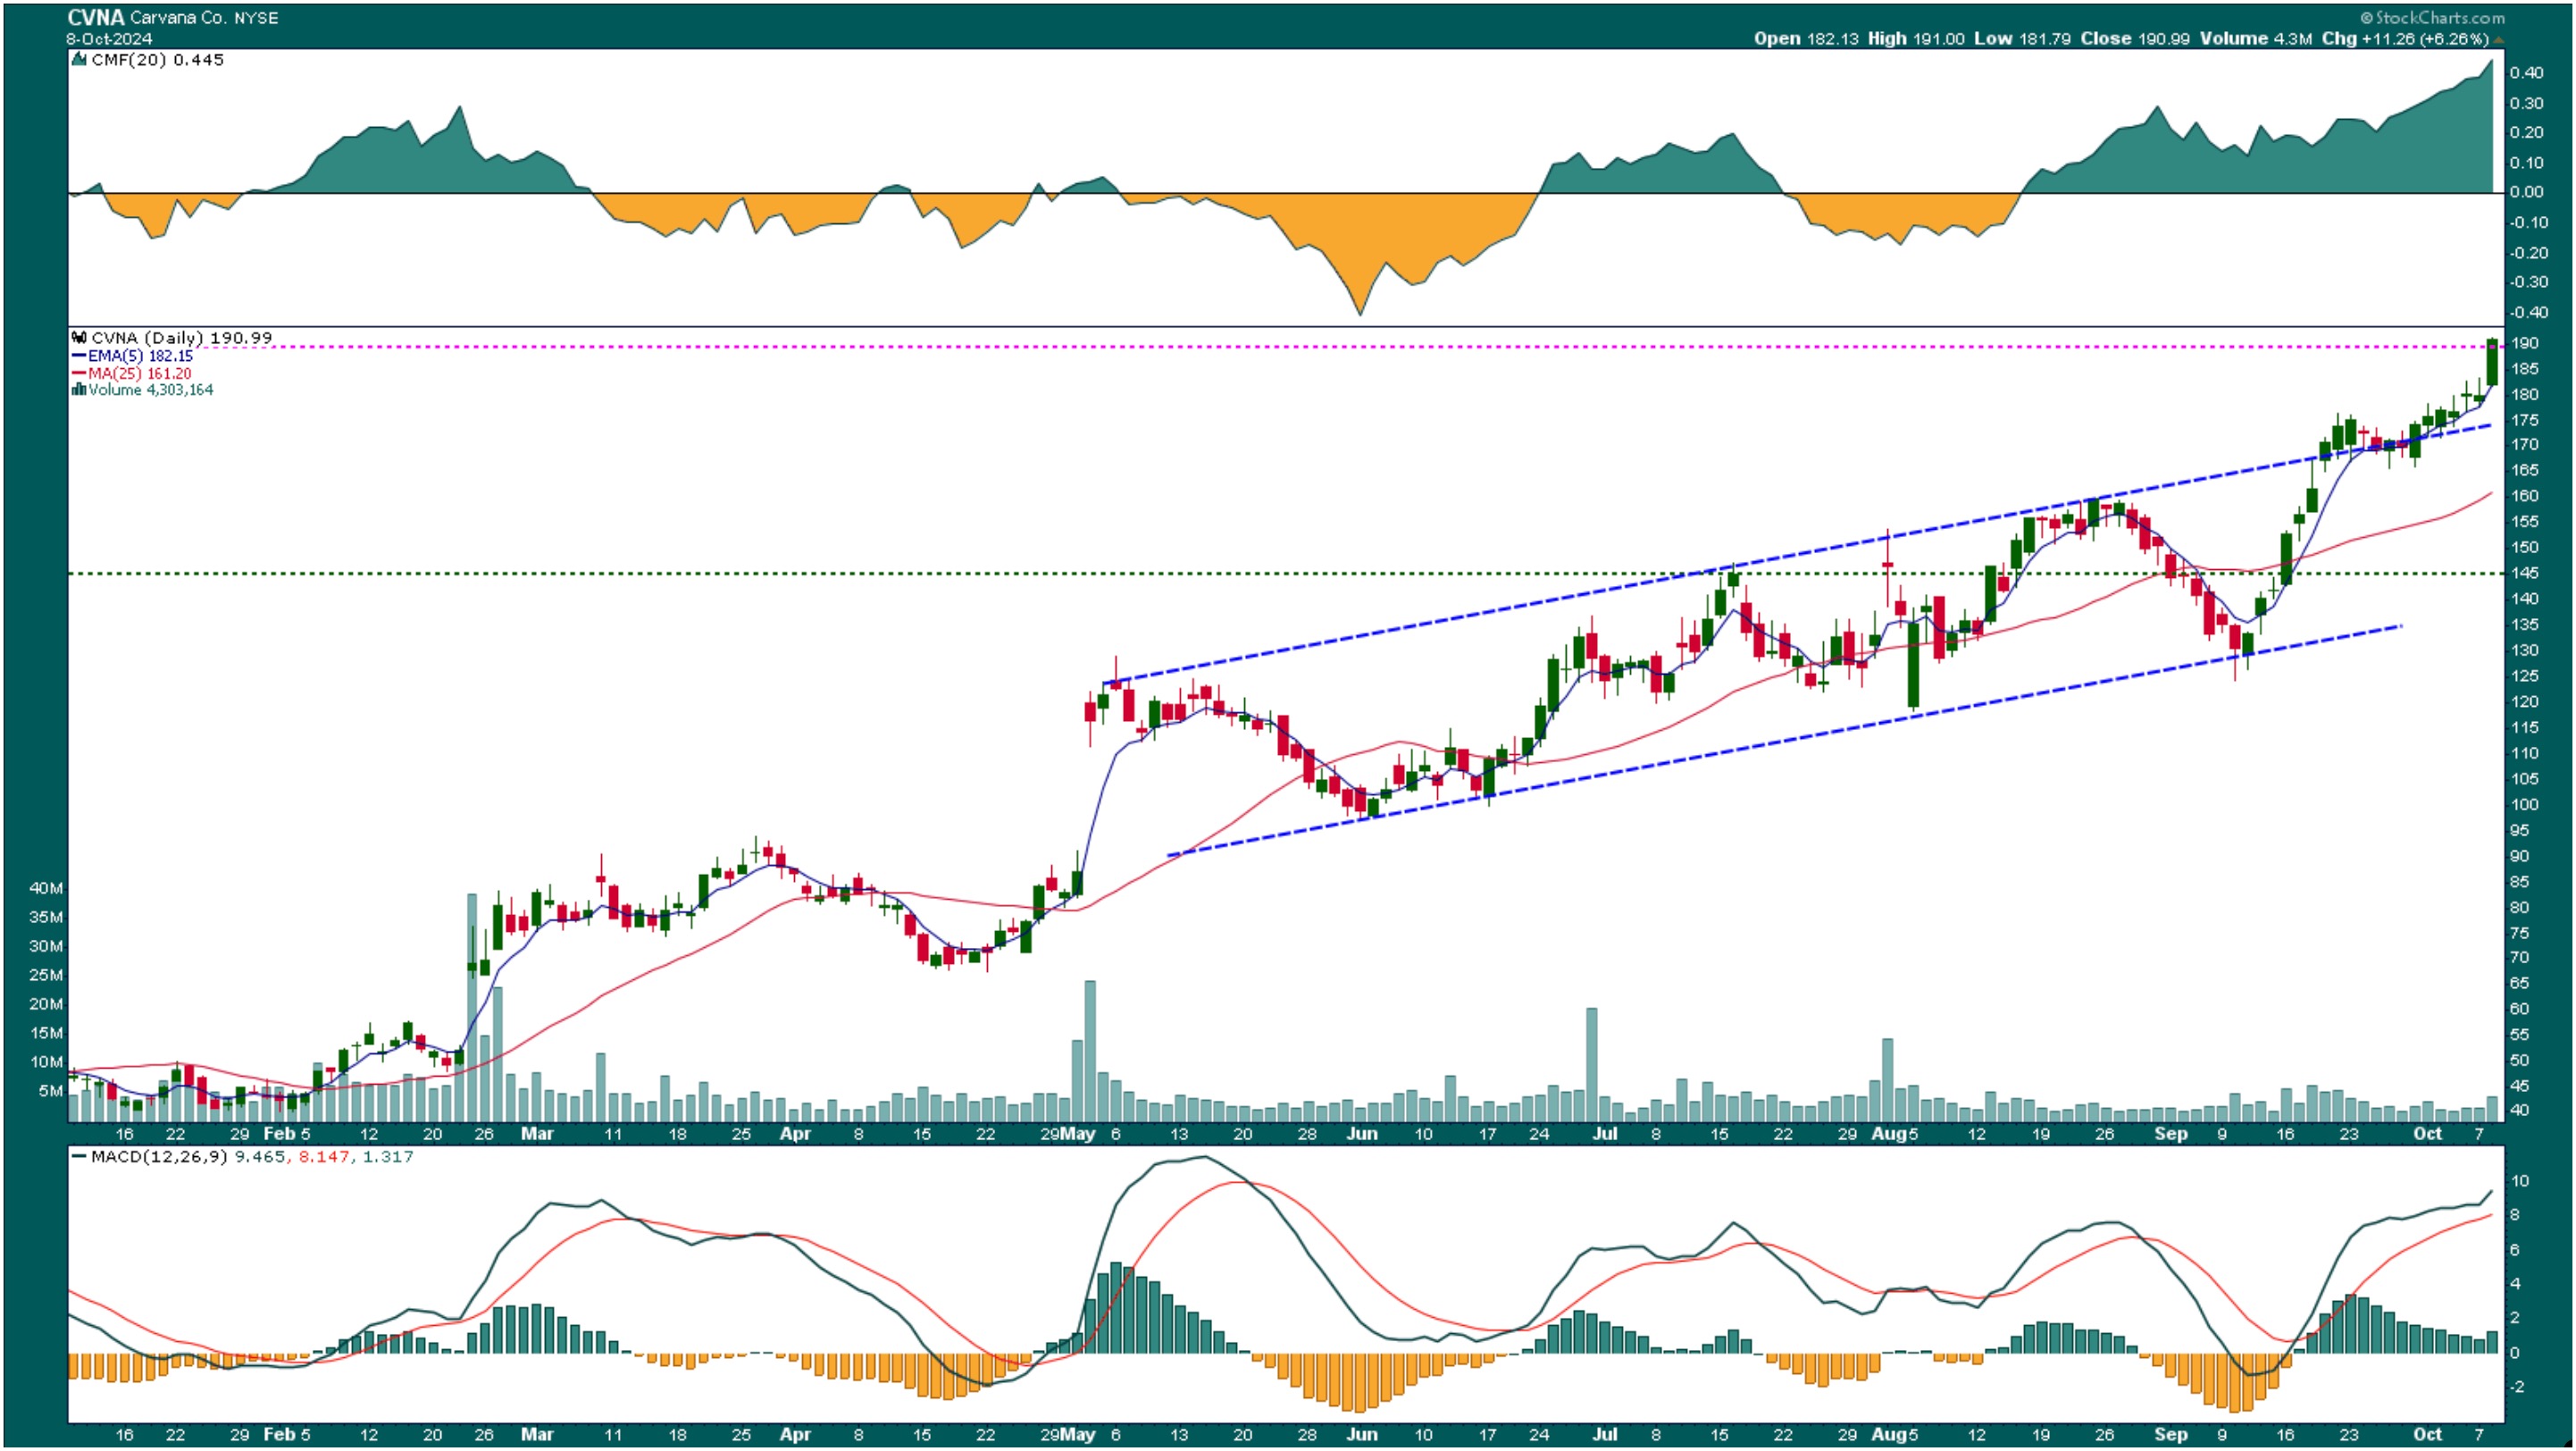
CHART 2. DAILY CHART OF CARVANA STOCK. The stock broke out of its upward channel with rising CMF and MACD. It closed above $189.42. Will it push through and surge higher?Chart source: StockCharts.com. For educational purposes.
Carvana stock has broken out of its upward price channel. Instead of using the 21-day exponential moving average (EMA), I have shortened the period to a 5-day one to use as a trailing stop. I’ve also changed the longer-term simple moving average to a 25-period one.
The bottom line. Add the daily and weekly charts of CVNA to your StockCharts ChartLists and continue to monitor them. Set a StockCharts Alert to notify you when CVNA crosses below its 5-day EMA using the Advanced Alerts tool. If you’ve decided to unload some positions when price crosses below the 5-day EMA, follow your system. Making objective trading decisions can keep emotions at bay, which is a good habit to cultivate.

Disclaimer: This blog is for educational purposes only and should not be construed as financial advice. The ideas and strategies should never be used without first assessing your own personal and financial situation, or without consulting a financial professional.


