


Shiba Inu price consolidates inside a symmetrical triangle after surging 67% from September 18 to September 27. The days following this spike comprised lower highs and lower lows, forming a symmetrical triangle likely to break out in the direction of the preceding trend. If this happens, SHIB price is looking at a 108% potential gain to $0.00003620.
On-chain and Futures Metrics Signal Shiba Inu Price
Data from IntoTheBlock (ITB) shows the Market Value to Realized Value Ratio (MVRV) increased from 0.89 to 0.96 while the price remained stagnant between October 11 and 12. When this happens, it suggests that investors are holding onto their assets without selling, leading to a higher market value compared to the realized value.
Market Value to Realized Value Ratio
This ratio can also indicate increased investor confidence and a belief that the asset will appreciate in the future, even if the current price hasn’t moved much. Furthermore, ITB shows the SHIB large transaction volume increased by $66 million between Oct 11 and 12, an increase of 46.79%.
The Coinglass Spot netflow data shows 7 days of continuous outflows for SHIB. This suggests that the earlier observation of large transactions could be whales accumulating SHIB tokens, which is bullish for the Shiba Inu price.
SHIB price has increased by 0.8% in the last 24 hours and is trading at $0.000077. The Shiba Inu technical analysis shows potential for the price to surge to $0.000032
SHIB Price Analysis: Bulls Lock Eyes on 108% Gains
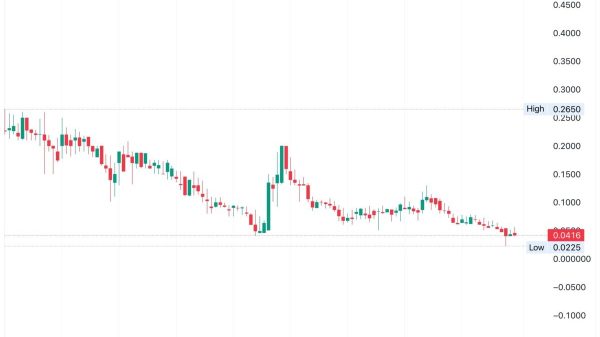
The SHIB daily chart shows a bullish breakout pattern following a symmetrical triangle formation. The meme coin has been consolidating within the triangle since early October, indicating a potential breakout soon.
With the Shiba Inu price nearing the apex of the triangle, a breakout above the resistance trendline could trigger a significant rally.
Fibonacci Retracement applied from the previous high to low shows that SHIB hovers around the 50% retracement level. A breakout above $0.00001872 (corresponding to a 108% extension) would confirm bullish momentum. Some of the key levels to look out for while investing in Shiba Inu include:
The 23.6% retracement (near the triangle resistance). Which aligns with $0.0000205 38.2% retracement around $0.0000220. Target Extension (161.8%): $0.0000340.
SHIB has an immediate support of around $0.000016, equivalent to the 61.8% Fibonacci level.
Recent candlesticks are relatively small and indecisive, signaling consolidation. However, these can often precede significant breakouts, especially in triangle patterns.
Shiba Inu price analysis chart
Shiba Inu price prediction shows if the asset fails to break out to the upside of the symmetrical triangle, it may drop downward and retest the $0.000016 area in the coming weeks, aligning with Fibonacci extensions and the historical resistance levels from mid-August. As the crypto market continues to move, all eyes will be on the upcoming movements within this symmetrical triangle, making now a critical time for potential investors to watch Shiba Inu.
The post Can Shiba Inu Price Break Out? $66M Whale Activity Point to 108% Gains appeared first on CoinGape.


